NGC 2613 hot halo: existing data and XMM-Newton exposure feasibility
1. Existing XMM data and good time
This page uses the MOS spectra of ObsID 0149160201 only. ObsID 0149160101 is affected by strong background flaring (the draft calls it unusable) and is not used. The filtered GTI of 0149160201 has not yet been re-derived interval by interval as for NGC 4565; the table lists the final spectrum EXPOSURE.
| ObsID | Instrument | Filtered GTI (ks) | Spectrum EXPOSURE (ks) | Note |
|---|---|---|---|---|
| 0149160201 | MOS1 | — | 22.97 | used |
| 0149160201 | MOS2 | — | 23.01 | used |
| 0149160201 | pn | — | 17.85 | not used here |
| 0149160101 | MOS1 / MOS2 / pn | — | 8.10 / 2.06 / 9.61 | strong flaring, not used |
2. Optical and X-ray images
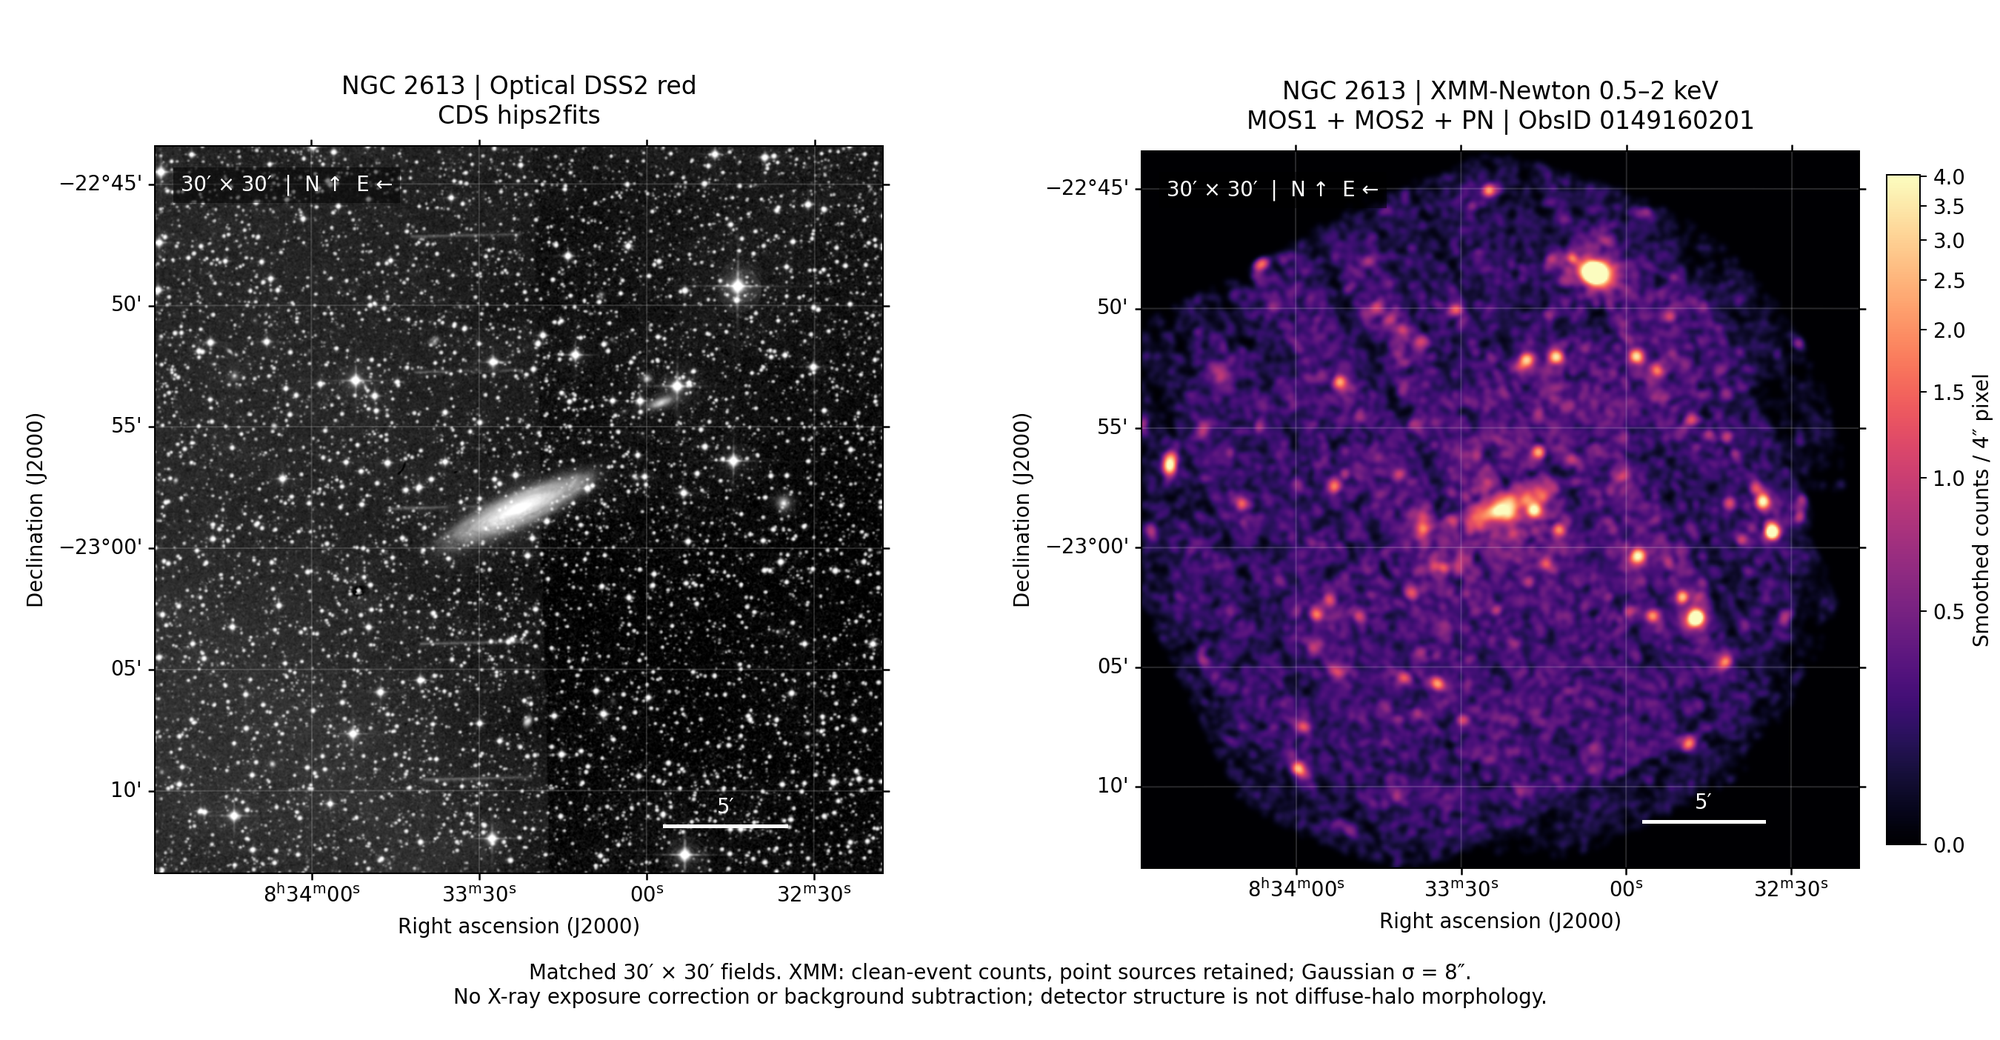
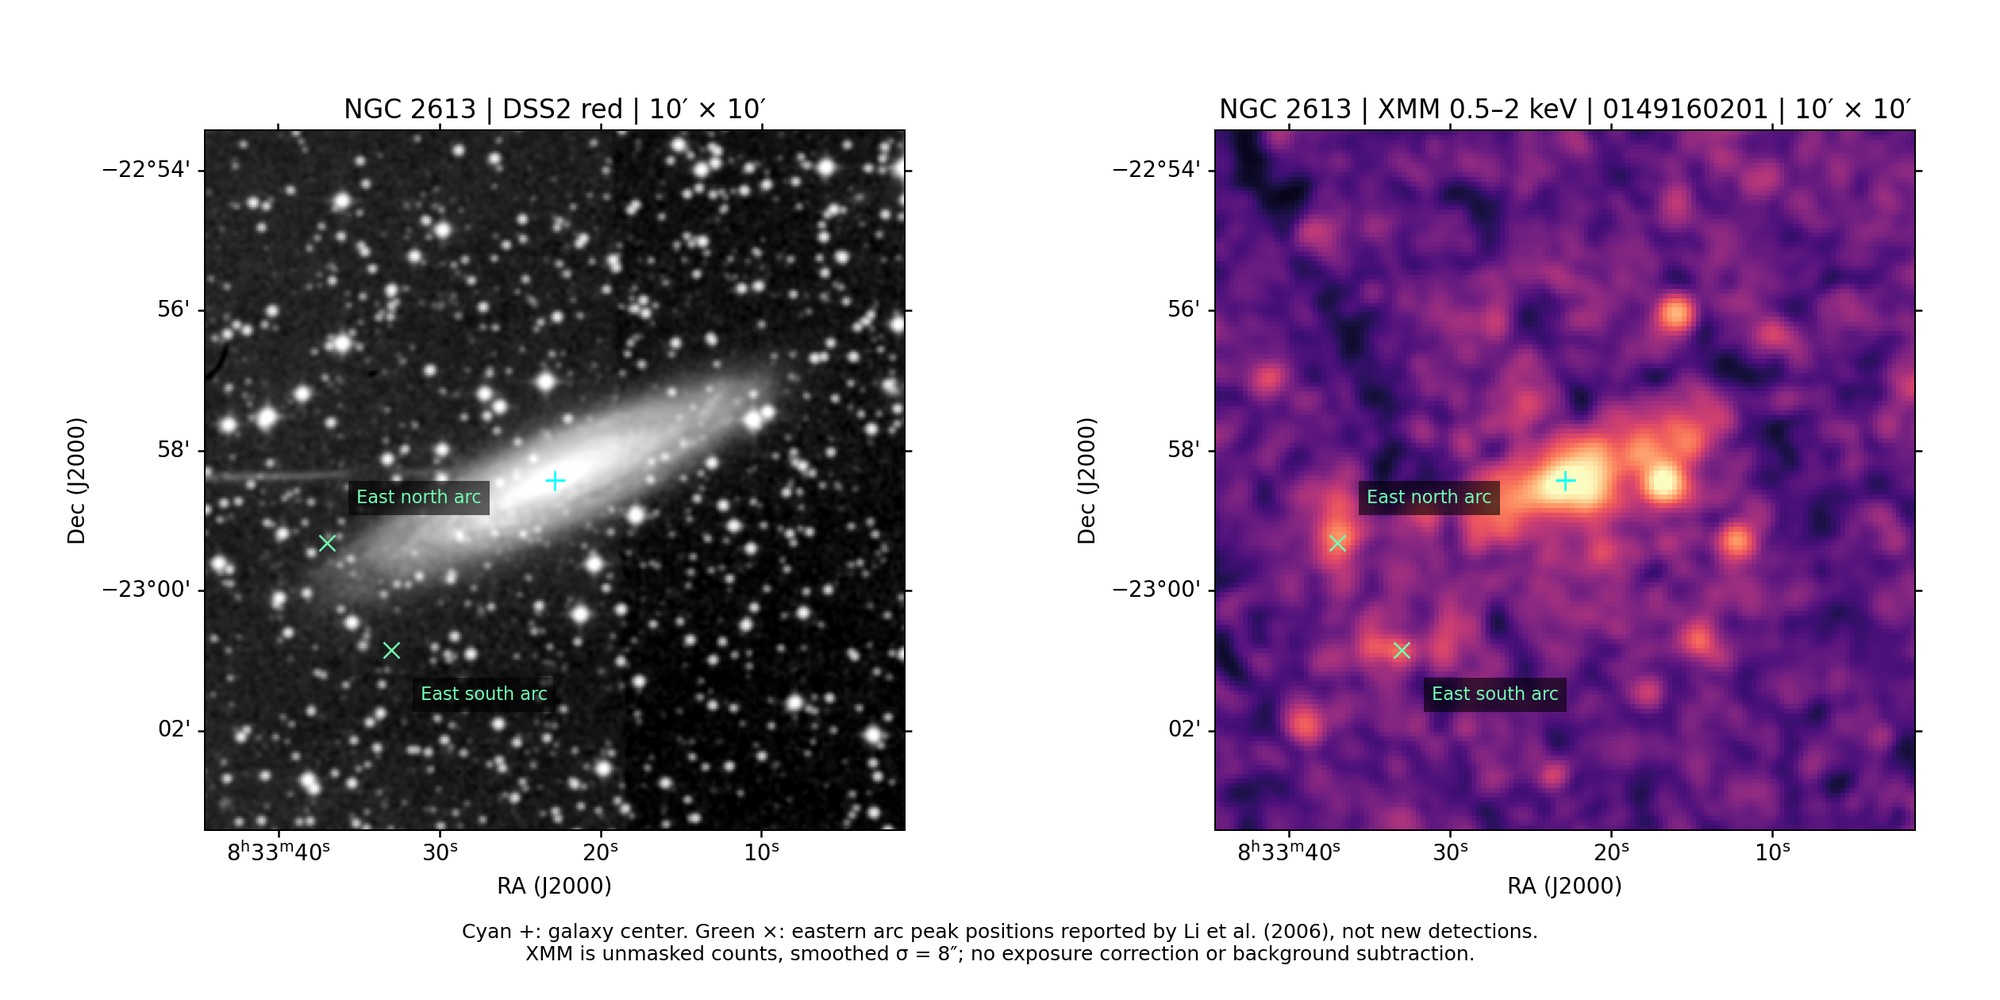
30′ × 30′ fields: DSS2 red (CDS hips2fits) and 0.5–2 keV MOS1+MOS2+pn counts of ObsID 0149160201 (point sources retained, no exposure or background correction). The second panel is a 10′ view marking structures reported in the literature.
3. Spectral extraction regions
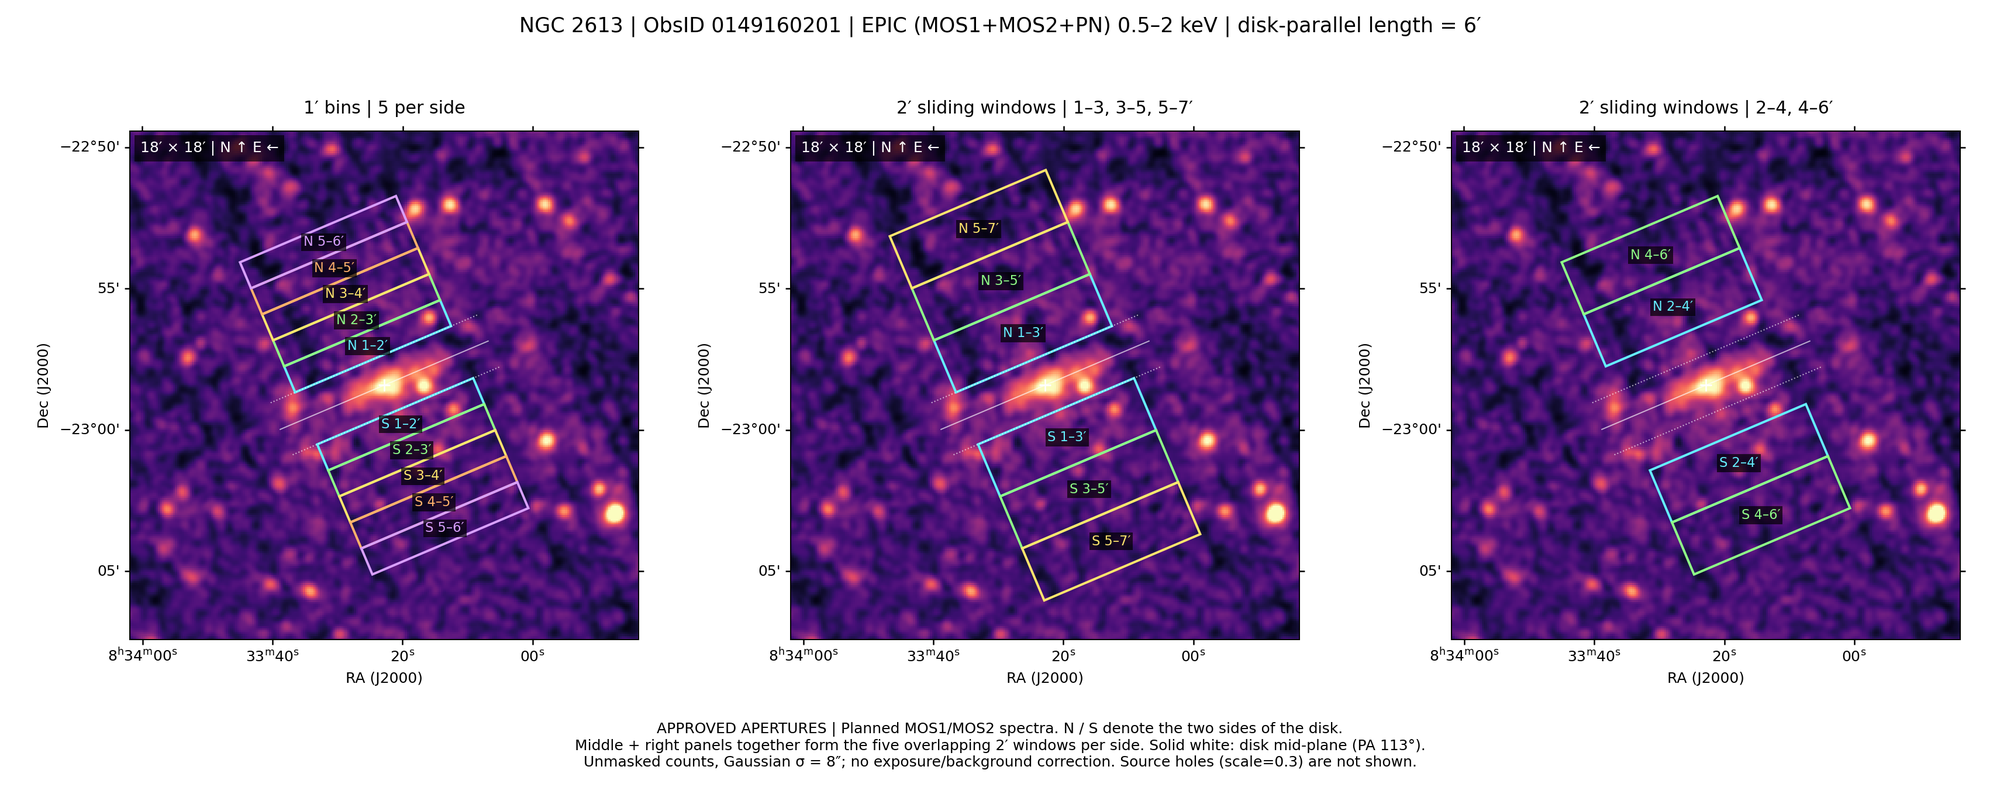
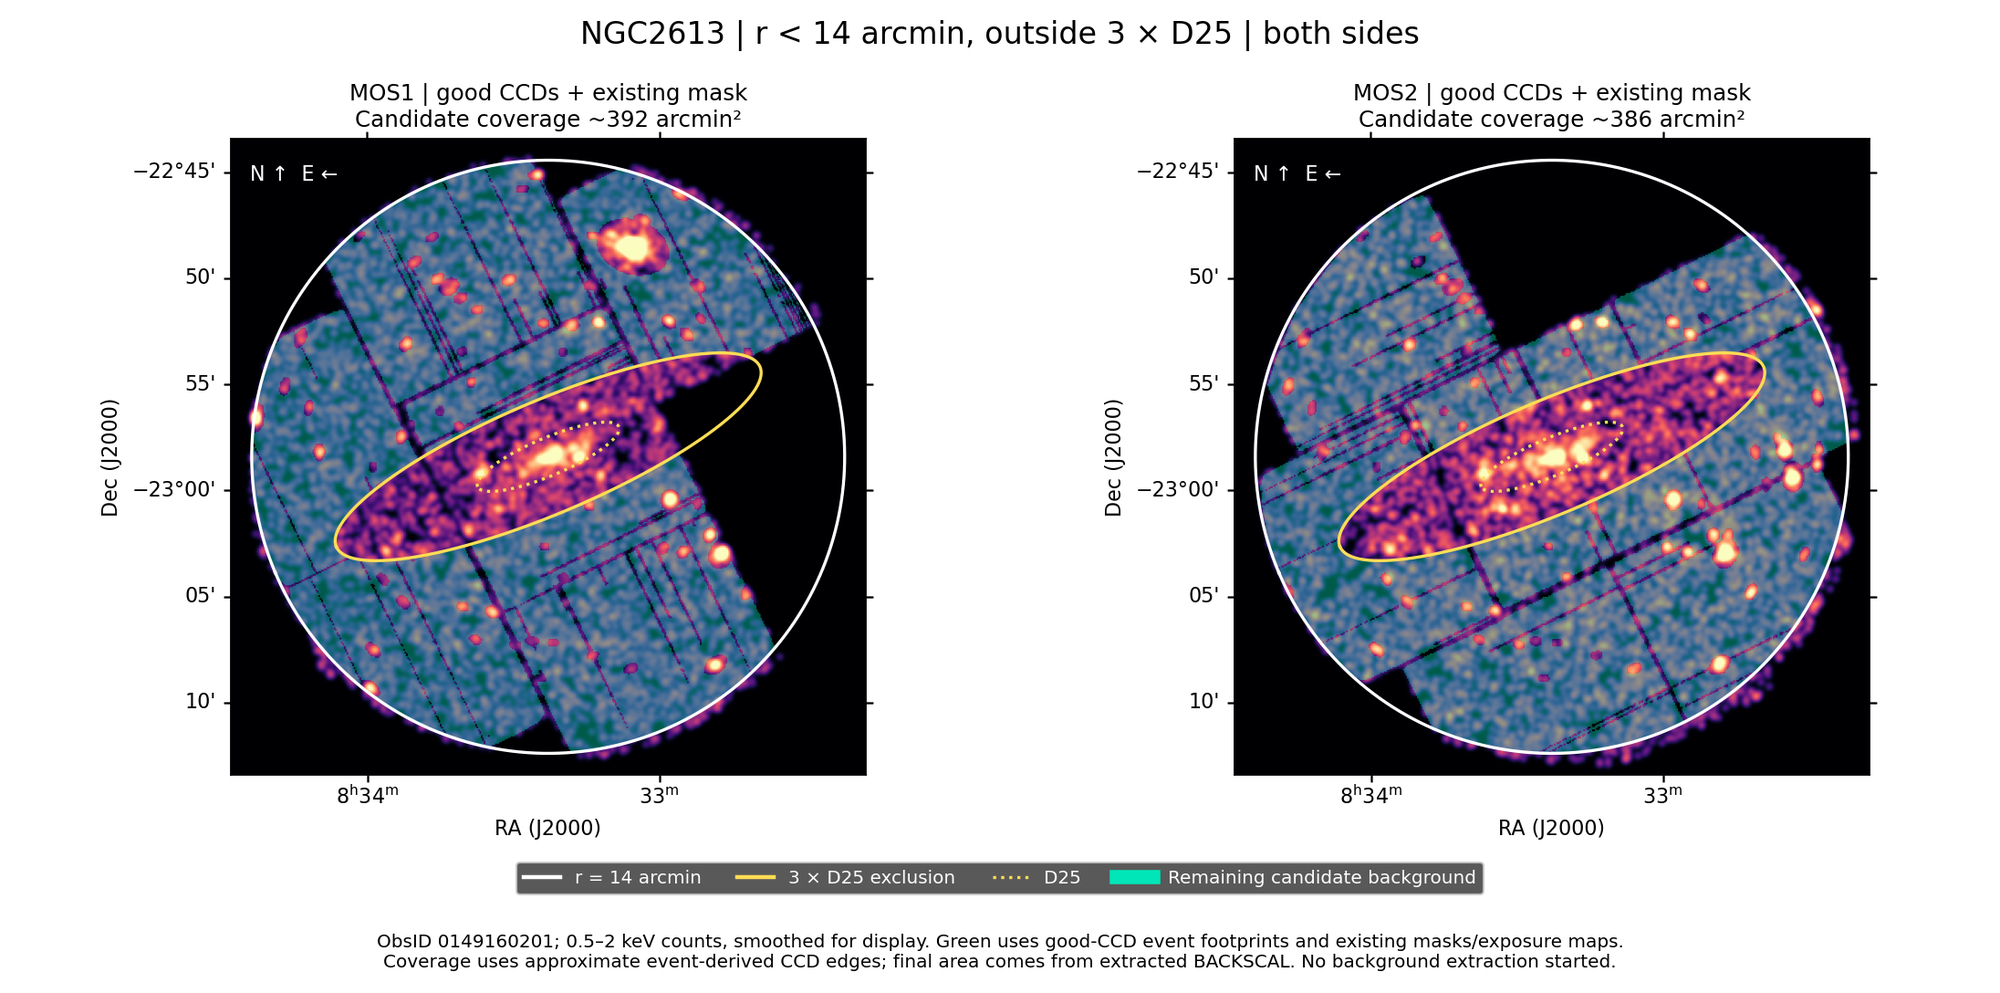
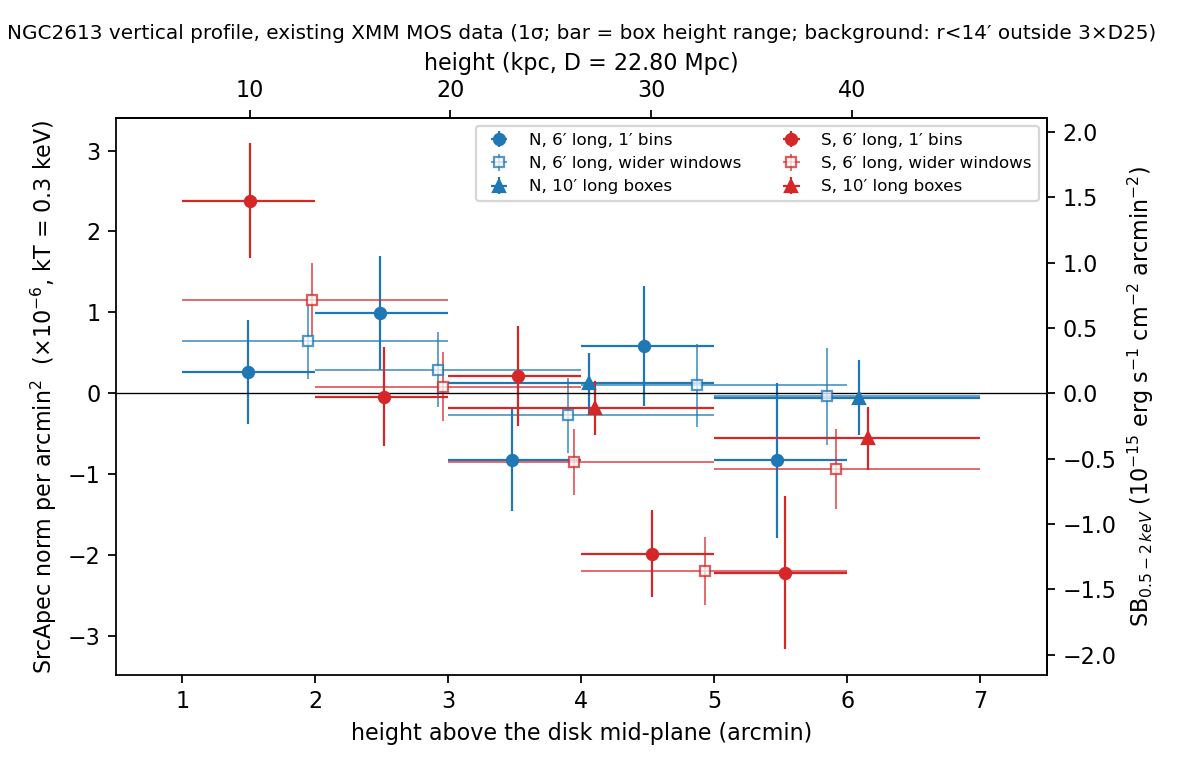
Vertical boxes on both sides of the disk (N and S), 6′ long parallel to the disk; point sources removed with cheese scale = 0.3. N and S spectra at the same height are fitted jointly (own responses, shared SrcApec). The background region is r < 14′ and outside 3 × D25.
| Region set | Regions | Height (kpc) | Effective area (arcmin²; after point-source removal, MOS mean, sides summed) | Role |
|---|---|---|---|---|
| N+S 1–3′ | N_1_3 + S_1_3 | 6.6–19.9 | 22.0 | baseline (wide halo region) |
| N+S 1–2′ | N_1_2 + S_1_2 | 6.6–13.3 | 10.9 | height bin |
| N+S 2–3′ | N_2_3 + S_2_3 | 13.3–19.9 | 11.1 | height bin |
| N+S 3–5′ | N_3_5 + S_3_5 | 19.9–33.2 | 22.7 | sensitivity check |
| N+S 4–6′ | N_4_6 + S_4_6 | 26.5–39.8 | 20.5 | sensitivity check |
| N+S 5–7′ | N_5_7 + S_5_7 | 33.2–46.4 | 18.3 | sensitivity check |
| BKG | BKG_r14_out3D25 | — | 406 / 398 (MOS1/MOS2) | r < 14′ and outside 3×D25 |
4. Vertical surface-brightness profile (existing data)
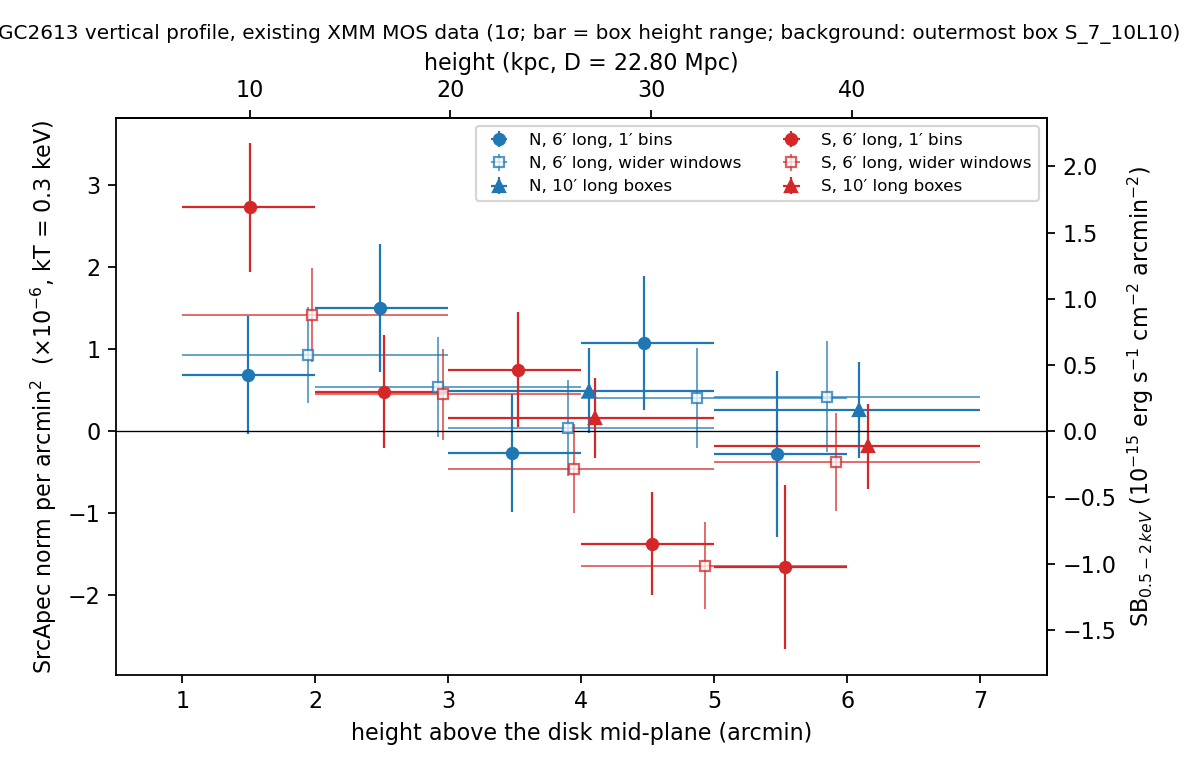
Every extracted box fitted on its own (kT fixed at 0.3 keV; a signed amplitude lets the norm go negative). Only S 1–2′ shows a clear positive signal (Δχ² ≈ 11); the N side is consistent with zero at all heights (a north–south asymmetry). With the r14 background the 6′-long S 4–5′ and 4–6′ boxes came out significantly negative (−2.2 ± 0.4×10⁻⁶). Option (a) check — only the outermost S 7–10′ box (46–66 kpc) as background: all boxes shift up by ≈0.4–0.5×10⁻⁶; the new 10′-long boxes at 3–5′ and 5–7′ are consistent with zero on both sides (e.g. S 3–5′: 0.16 ± 0.49, S 5–7′: −0.19 ± 0.52×10⁻⁶); S 1–2′ stays detected (2.7 ± 0.8×10⁻⁶, Δχ² ≈ 12). Only the two small 6′ S 4–6′ boxes remain negative (−1.4 to −1.6×10⁻⁶), while 10′ boxes covering the same heights are ≈0, so this is a local feature of those boxes (mask/chip-gap/detector), not a large-scale background gradient. The r14 background was slightly too bright (≈0.4×10⁻⁶).
| Box | Height (kpc) | Area (arcmin², MOS mean) | Spectra | norm per arcmin² (1σ) | Δχ² (1 d.o.f.) | SB 0.5–2 keV (erg/s/cm²/arcmin²) |
|---|---|---|---|---|---|---|
| N 1–2′ | 6.6–13.3 | 5.5 | MOS1+MOS2 | 2.6×10⁻⁷ ± 6.4×10⁻⁷ | 0.2 | 1.6×10⁻¹⁶ |
| N 2–3′ | 13.3–19.9 | 5.4 | MOS1+MOS2 | 9.9×10⁻⁷ ± 7.1×10⁻⁷ | 2.0 | 6.1×10⁻¹⁶ |
| N 3–4′ | 19.9–26.5 | 5.5 | MOS1+MOS2 | -8.2×10⁻⁷ ± 6.4×10⁻⁷ | 1.6 | -5.1×10⁻¹⁶ |
| N 4–5′ | 26.5–33.2 | 5.4 | MOS1+MOS2 | 5.8×10⁻⁷ ± 7.5×10⁻⁷ | 0.6 | 3.6×10⁻¹⁶ |
| N 5–6′ | 33.2–39.8 | 5.4 | MOS1 | -8.3×10⁻⁷ ± 9.6×10⁻⁷ | 0.7 | -5.1×10⁻¹⁶ |
| N 1–3′ | 6.6–19.9 | 10.9 | MOS1+MOS2 | 6.4×10⁻⁷ ± 4.7×10⁻⁷ | 1.9 | 4.0×10⁻¹⁶ |
| N 2–4′ | 13.3–26.5 | 10.9 | MOS1+MOS2 | 2.9×10⁻⁷ ± 4.6×10⁻⁷ | 0.4 | 1.8×10⁻¹⁶ |
| N 3–5′ | 19.9–33.2 | 10.8 | MOS1+MOS2 | -2.7×10⁻⁷ ± 4.7×10⁻⁷ | 0.3 | -1.7×10⁻¹⁶ |
| N 4–6′ | 26.5–39.8 | 9.8 | MOS1+MOS2 | 1.0×10⁻⁷ ± 5.1×10⁻⁷ | 0.0 | 6.3×10⁻¹⁷ |
| N 5–7′ | 33.2–46.4 | 7.8 | MOS1+MOS2 | -3.7×10⁻⁸ ± 6.0×10⁻⁷ | 0.0 | -2.3×10⁻¹⁷ |
| N 3–5′ (10′ long) | 19.9–33.2 | 18.6 | MOS1+MOS2 | 1.2×10⁻⁷ ± 3.8×10⁻⁷ | 0.1 | 7.7×10⁻¹⁷ |
| N 5–7′ (10′ long) | 33.2–46.4 | 13.7 | MOS1+MOS2 | -5.2×10⁻⁸ ± 4.6×10⁻⁷ | 0.0 | -3.2×10⁻¹⁷ |
| S 1–2′ | 6.6–13.3 | 5.4 | MOS1+MOS2 | 2.4×10⁻⁶ ± 7.1×10⁻⁷ | 11.2 | 1.5×10⁻¹⁵ |
| S 2–3′ | 13.3–19.9 | 5.7 | MOS1+MOS2 | -4.0×10⁻⁸ ± 6.1×10⁻⁷ | 0.0 | -2.5×10⁻¹⁷ |
| S 3–4′ | 19.9–26.5 | 5.9 | MOS1+MOS2 | 2.1×10⁻⁷ ± 6.2×10⁻⁷ | 0.1 | 1.3×10⁻¹⁶ |
| S 4–5′ | 26.5–33.2 | 6.0 | MOS1+MOS2 | -2.0×10⁻⁶ ± 5.4×10⁻⁷ | 13.6 | -1.2×10⁻¹⁵ |
| S 5–6′ | 33.2–39.8 | 5.4 | MOS1 | -2.2×10⁻⁶ ± 9.5×10⁻⁷ | 5.5 | -1.4×10⁻¹⁵ |
| S 1–3′ | 6.6–19.9 | 11.1 | MOS1+MOS2 | 1.2×10⁻⁶ ± 4.5×10⁻⁷ | 6.6 | 7.2×10⁻¹⁶ |
| S 2–4′ | 13.3–26.5 | 11.6 | MOS1+MOS2 | 8.1×10⁻⁸ ± 4.3×10⁻⁷ | 0.0 | 5.0×10⁻¹⁷ |
| S 3–5′ | 19.9–33.2 | 11.9 | MOS1+MOS2 | -8.5×10⁻⁷ ± 4.1×10⁻⁷ | 4.3 | -5.3×10⁻¹⁶ |
| S 4–6′ | 26.5–39.8 | 10.7 | MOS1+MOS2 | -2.2×10⁻⁶ ± 4.2×10⁻⁷ | 27.2 | -1.4×10⁻¹⁵ |
| S 5–7′ | 33.2–46.4 | 10.4 | MOS1+MOS2 | -9.3×10⁻⁷ ± 5.0×10⁻⁷ | 3.5 | -5.8×10⁻¹⁶ |
| S 3–5′ (10′ long) | 19.9–33.2 | 18.9 | MOS1+MOS2 | -1.8×10⁻⁷ ± 3.4×10⁻⁷ | 0.3 | -1.1×10⁻¹⁶ |
| S 5–7′ (10′ long) | 33.2–46.4 | 17.3 | MOS1+MOS2 | -5.6×10⁻⁷ ± 3.9×10⁻⁷ | 2.0 | -3.4×10⁻¹⁶ |
5. Background spectral fit (sky + instrument)
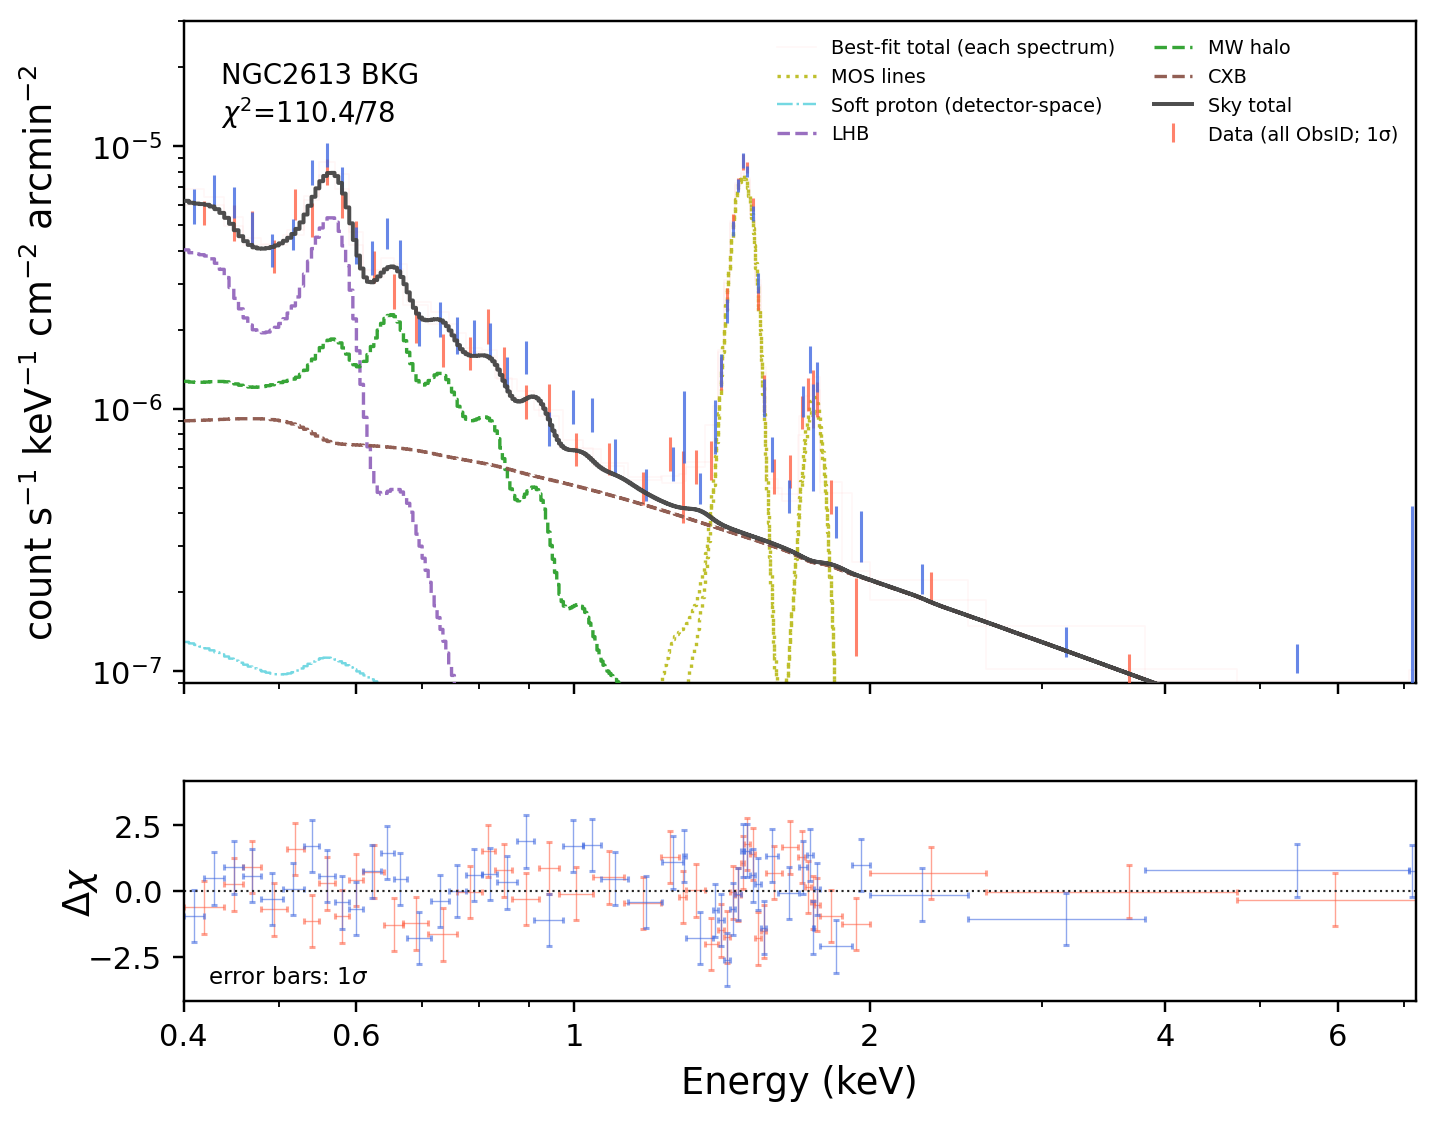
XSherpa recipe xartatoms_0900170701_background (profile status STRUCTURAL_PREFLIGHT_ONLY; no numerical equivalence to XARTATOMS is claimed). The only change is the Galactic NH = 0.0574×1022 cm-2 (HI4PI). Sky components are shared by MOS1/MOS2; instrumental lines and the broken-power-law soft proton are independent per spectrum. Grouping: net S/N ≥ 6 with RMF-FWHM oversampling ≤ 6; 0.4–7.2 keV; chi2gehrels; CIAO 4.18 / Sherpa 4.18 / XSPEC 12.14.0k, angr. χ²/dof = 110.4/78; empirical quality audit: WARN (see note). Norms are per arcmin².
| Component | kT (keV) | norm (per arcmin²) |
|---|---|---|
| LHB | 0.108 | 2.7×10⁻⁶ |
| MW halo | 0.255 | 2.0×10⁻⁶ |
| CXB (pegpwrlw, Γ=1.4) | — | 1.4×10⁻³ |
6. Halo signal in the existing data (SrcApec)
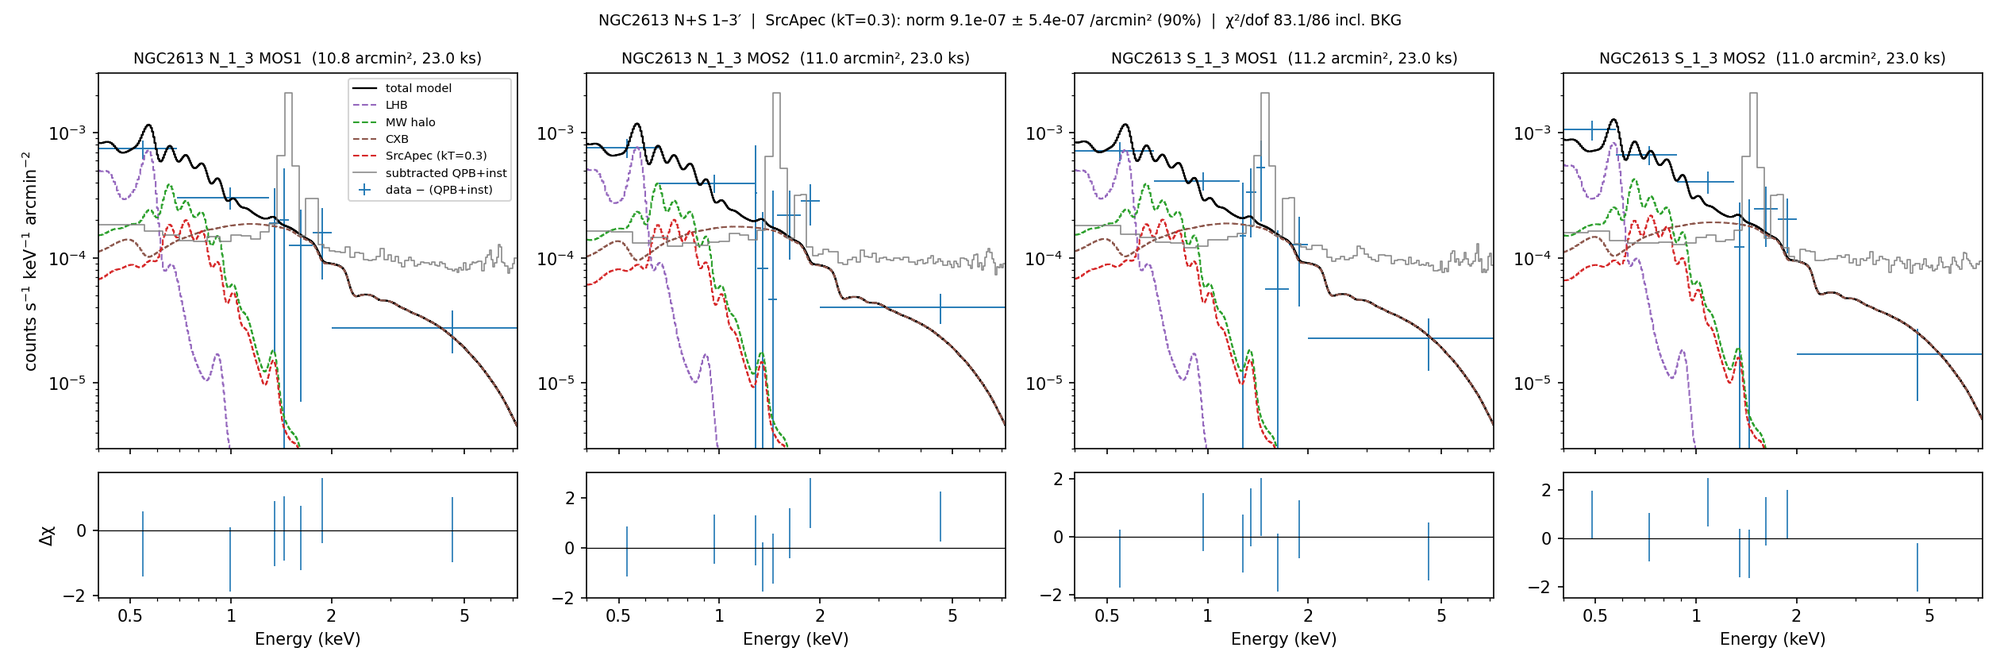
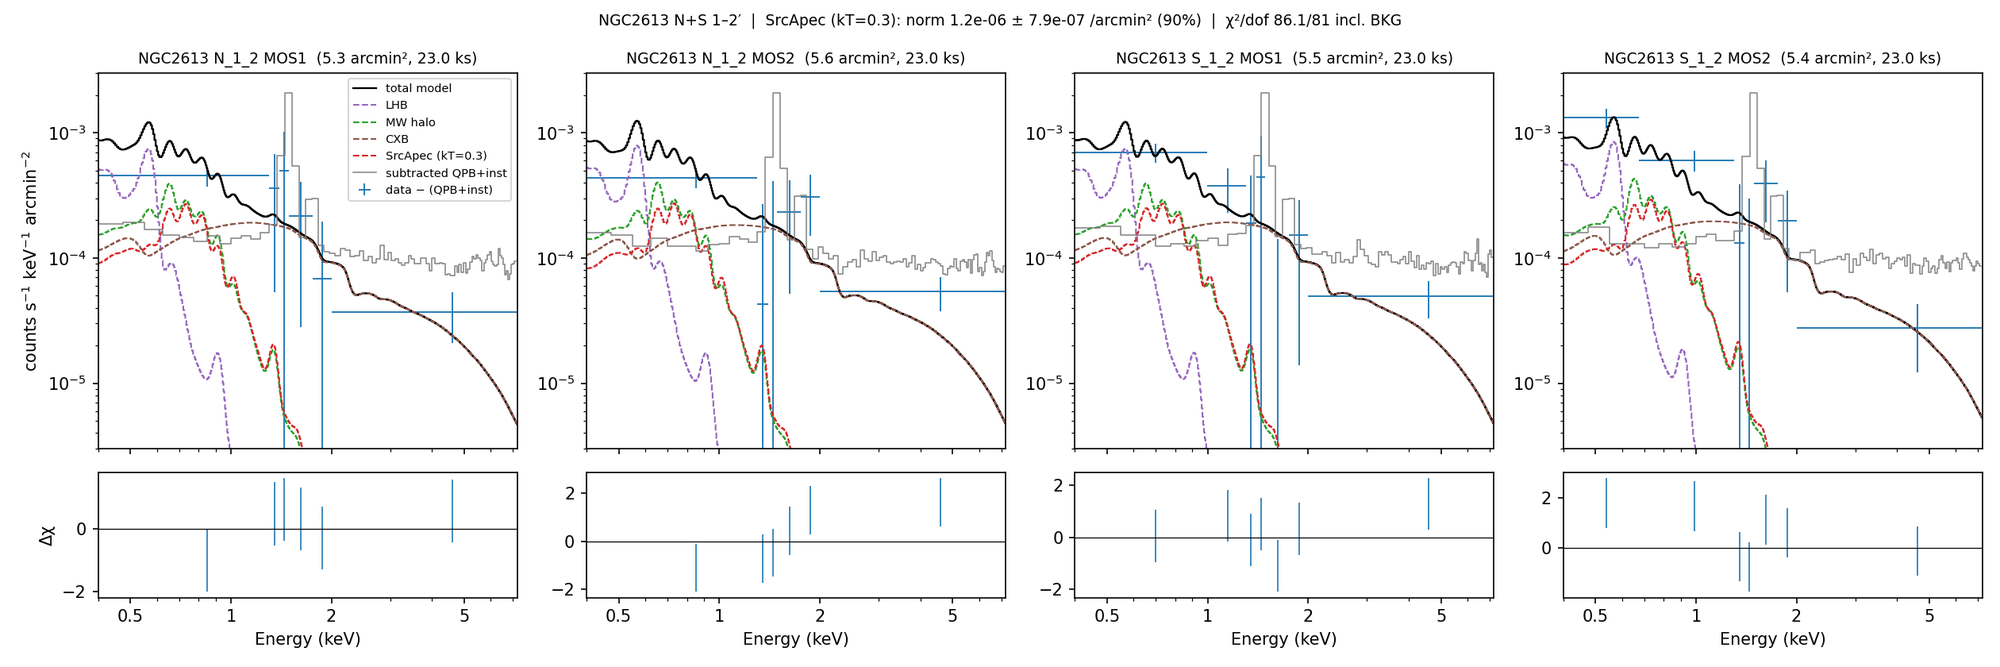
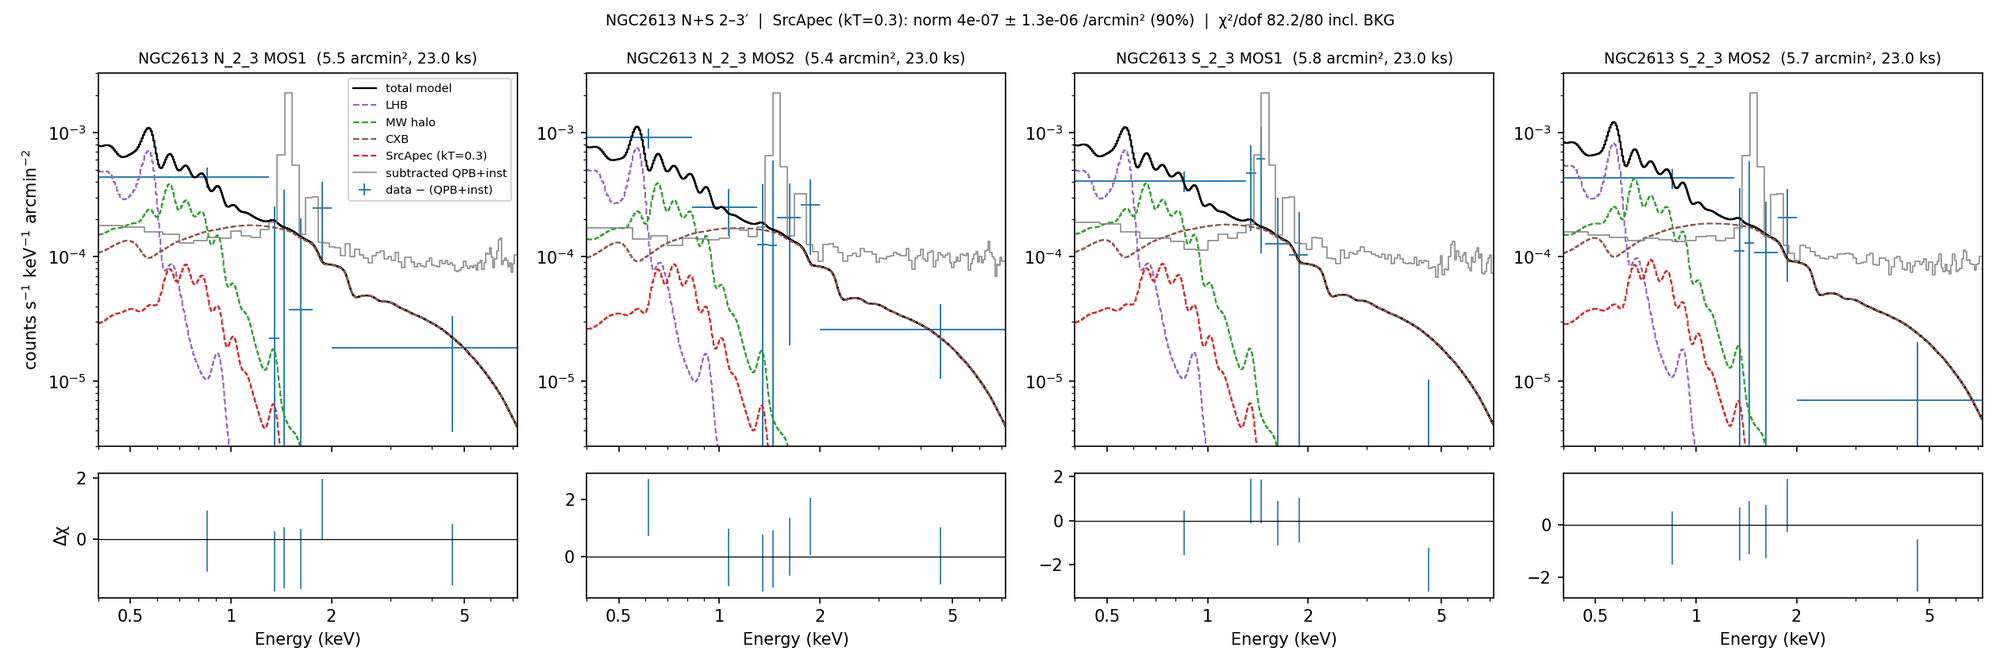
Same estimator as the simulations: source and background spectra fitted jointly; LHB / MW-halo / CXB norms free (temperatures fixed at the background-fit values); MOS instrumental lines and soft protons taken per arcmin² from the background fit and subtracted with the QPB as a known background; SrcApec abundance fixed at 0.3 solar. Δχ² is the increase in χ² when SrcApec is removed (kT and norm free, 2 d.o.f.; 3σ ≈ 11.8). Errors are 90% (covariance). Surface brightness is the unabsorbed 0.5–2 keV energy flux for kT = 0.3 keV: norm 1×10⁻⁶ arcmin-2 ≈ 6.2×10⁻¹⁶ erg s-1 cm-2 arcmin-2.
| Region set | Δχ² | kT, free fit (keV) | norm @ kT = 0.3 (per arcmin², 90%) | SB 0.5–2 keV (erg/s/cm²/arcmin²) | χ²/dof |
|---|---|---|---|---|---|
| N+S 1–3′ | 8.5 | 0.87 | 9.1×10⁻⁷ ± 5.4×10⁻⁷ | 5.6×10⁻¹⁶ | 83.1/86 |
| N+S 1–2′ | 8.1 | unconstrained (at bound 3.00) | 1.2×10⁻⁶ ± 7.9×10⁻⁷ | 7.4×10⁻¹⁶ | 86.1/81 |
| N+S 2–3′ | 1.2 | unconstrained (at bound 0.08) | 4.0×10⁻⁷ ± 1.3×10⁻⁶ | 2.5×10⁻¹⁶ | 82.2/80 |
| N+S 3–5′ | -0.0 | unconstrained (at bound 0.08) | 0 ± 1.8×10⁻⁷ | 0 | 107.1/82 |
| N+S 4–6′ | -0.0 | unconstrained (at bound 0.08) | 0 ± 1.3×10⁻⁷ | 0 | 135.9/81 |
| N+S 5–7′ | -0.6 | unconstrained (at bound 0.08) | 0 ± 2.4×10⁻⁷ | 0 | 101.6/80 |
N+S 1–3′ and 1–2′ reach only Δχ² ≈ 8 (≈2.5σ); a free-kT fit is unconstrained. With kT fixed at 0.3 keV the 1–3′ norm is (0.9 ± 0.5)×10-6 arcmin-2 (90%), about one third of NGC 4565 at the same angular height. 2–3′ is consistent with zero.
7. Simulation method
- Truth: sky from the background-fit anchor; SrcApec (kT, norm per arcmin², Z = 0.3); MOS instrumental lines and soft protons per arcmin² from the background fit; each region’s own ESAS QPB spectrum. Everything is folded through the real ARF/RMF of that region.
- Each realization: Poisson draws for both the source and the background region at a new exposure T (clean time of MOS1 and of MOS2); QPB + instrumental terms subtracted as a known, noise-free background; xsherpa net S/N ≥ 6 grouping; joint chi2gehrels fit with SrcApec kT and norm and the three sky norms free; a second fit without SrcApec gives Δχ².
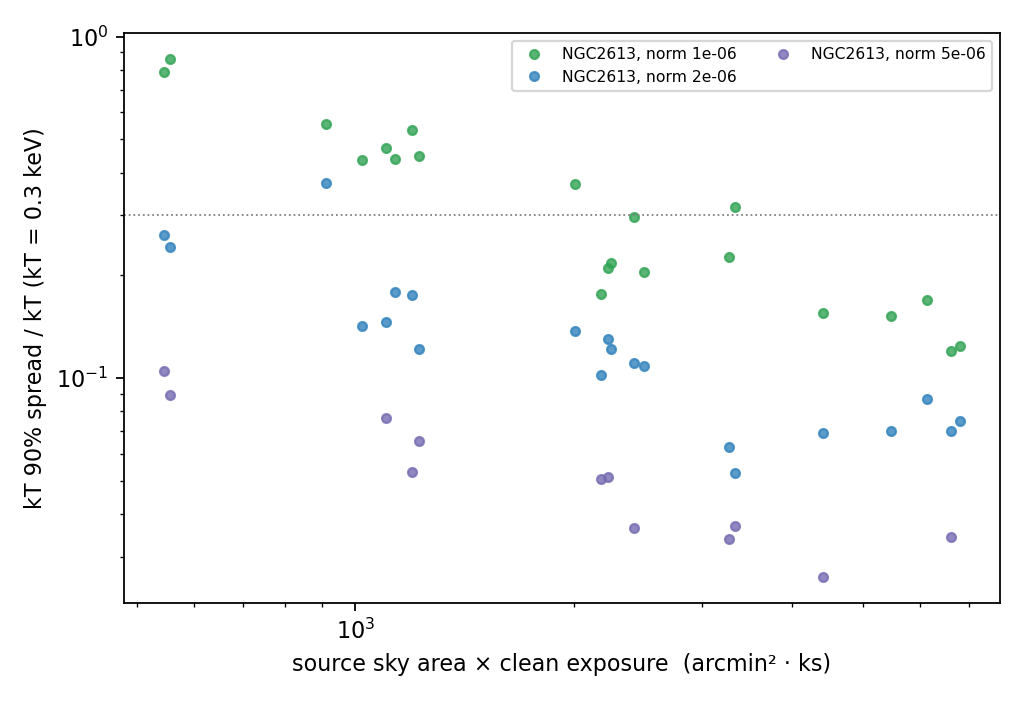
- Detection: Δχ² ≥ 11.8 (3σ for 2 d.o.f.), checked against the false-positive rate of norm = 0 simulations. Temperature: the 5–95% half-width of the fitted-kT distribution divided by the true kT, and the fraction of realizations whose own 90% error is within ±30%.
- Grid: T = 50, 110, 200, 300 ks clean; kT = 0.3 keV (baseline), 0.2 and 0.5 keV at 110 ks; norm = 0.25–5 ×10⁻⁶ per arcmin² plus the brightness measured in the existing data; 30–100 realizations per cell.
- MOS only; adding pn should raise the counts by ~2.5× (margin, not yet simulated). Instrumental terms and QPB are taken as exactly known; the sky-background uncertainty is propagated through the joint fit.
8. Simulation results
T is the clean MOS exposure. The 110 ks request corresponds to ≈79 ks clean after the SOC-recommended 40% background allowance.
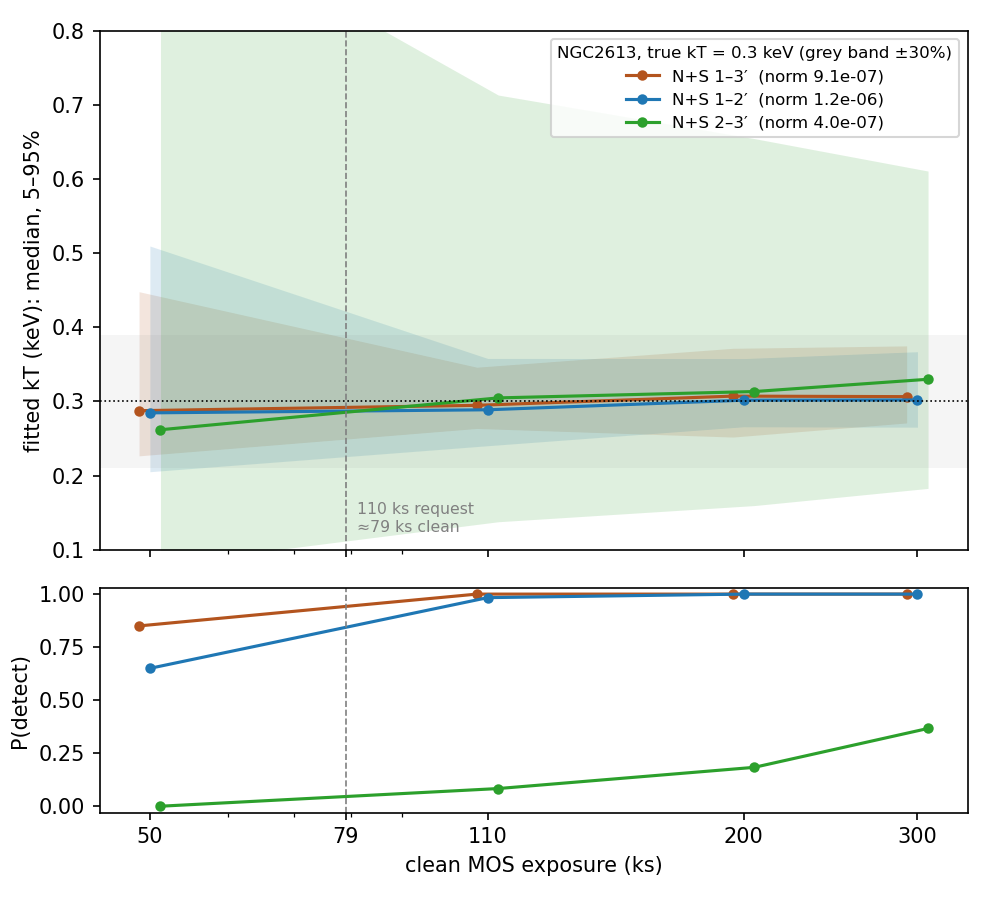
At the brightness measured in the existing data (true kT = 0.3 keV)
| Region set | Clean T (ks) | True norm | P(detect) | Fitted kT median [5%, 95%] | kT 5–95% half-width | Own 90% error within ±30% | N |
|---|---|---|---|---|---|---|---|
| N+S 1–3′ | 50 | 9.1×10⁻⁷ | 85% | 0.29 [0.23, 0.45] | ±37% | 33% | 60 |
| N+S 1–3′ | 110 | 9.1×10⁻⁷ | 100% | 0.29 [0.26, 0.35] | ±14% | 60% | 60 |
| N+S 1–3′ | 200 | 9.1×10⁻⁷ | 100% | 0.31 [0.25, 0.37] | ±20% | 83% | 60 |
| N+S 1–3′ | 300 | 9.1×10⁻⁷ | 100% | 0.31 [0.27, 0.37] | ±17% | 92% | 60 |
| N+S 1–2′ | 50 | 1.2×10⁻⁶ | 65% | 0.28 [0.21, 0.51] | ±51% | 22% | 60 |
| N+S 1–2′ | 110 | 1.2×10⁻⁶ | 98% | 0.29 [0.24, 0.36] | ±20% | 62% | 60 |
| N+S 1–2′ | 200 | 1.2×10⁻⁶ | 100% | 0.30 [0.27, 0.36] | ±15% | 77% | 60 |
| N+S 1–2′ | 300 | 1.2×10⁻⁶ | 100% | 0.30 [0.27, 0.37] | ±17% | 85% | 60 |
| N+S 2–3′ | 50 | 4.0×10⁻⁷ | 0% | 0.26 [0.08, 0.97] | ±148% | 5% | 60 |
| N+S 2–3′ | 110 | 4.0×10⁻⁷ | 8% | 0.30 [0.14, 0.71] | ±96% | 10% | 60 |
| N+S 2–3′ | 200 | 4.0×10⁻⁷ | 18% | 0.31 [0.16, 0.65] | ±83% | 12% | 60 |
| N+S 2–3′ | 300 | 4.0×10⁻⁷ | 37% | 0.33 [0.18, 0.61] | ±71% | 12% | 60 |
Minimum brightness required (kT = 0.3 keV)
Log-interpolated on the norm grid; “—” means not reached within the grid (≤ 5×10⁻⁶).
| Region set | Clean T (ks) | Ω·T (arcmin²·ks) | norm for 90% detection | kT ±30% in 50% of realizations | kT ±30% in 90% of realizations | SB for 90% detection (erg/s/cm²/arcmin²) |
|---|---|---|---|---|---|---|
| N+S 1–3′ | 50 | 1102 | 1.0×10⁻⁶ | 1.2×10⁻⁶ | 2.0×10⁻⁶ | 6.2×10⁻¹⁶ |
| N+S 1–3′ | 110 | 2424 | 7.9×10⁻⁷ | 7.8×10⁻⁷ | 1.8×10⁻⁶ | 4.9×10⁻¹⁶ |
| N+S 1–3′ | 200 | 4407 | 5.0×10⁻⁷ | 6.5×10⁻⁷ | 9.6×10⁻⁷ | 3.1×10⁻¹⁶ |
| N+S 1–3′ | 300 | 6610 | 4.5×10⁻⁷ | 5.4×10⁻⁷ | 8.8×10⁻⁷ | 2.8×10⁻¹⁶ |
| N+S 1–2′ | 50 | 545 | 1.8×10⁻⁶ | 2.0×10⁻⁶ | 3.4×10⁻⁶ | 1.1×10⁻¹⁵ |
| N+S 1–2′ | 110 | 1199 | 9.3×10⁻⁷ | 1.2×10⁻⁶ | 1.9×10⁻⁶ | 5.7×10⁻¹⁶ |
| N+S 1–2′ | 200 | 2180 | 8.6×10⁻⁷ | 7.6×10⁻⁷ | 1.6×10⁻⁶ | 5.3×10⁻¹⁶ |
| N+S 1–2′ | 300 | 3270 | 5.9×10⁻⁷ | 7.7×10⁻⁷ | 1.6×10⁻⁶ | 3.7×10⁻¹⁶ |
| N+S 2–3′ | 50 | 557 | 1.8×10⁻⁶ | 2.0×10⁻⁶ | 3.7×10⁻⁶ | 1.1×10⁻¹⁵ |
| N+S 2–3′ | 110 | 1225 | 9.2×10⁻⁷ | 1.1×10⁻⁶ | 2.0×10⁻⁶ | 5.7×10⁻¹⁶ |
| N+S 2–3′ | 200 | 2227 | 8.9×10⁻⁷ | 9.0×10⁻⁷ | 1.7×10⁻⁶ | 5.5×10⁻¹⁶ |
| N+S 2–3′ | 300 | 3340 | 6.8×10⁻⁷ | 6.6×10⁻⁷ | 1.3×10⁻⁶ | 4.2×10⁻¹⁶ |
Beyond 3′: detection and temperature limits versus height
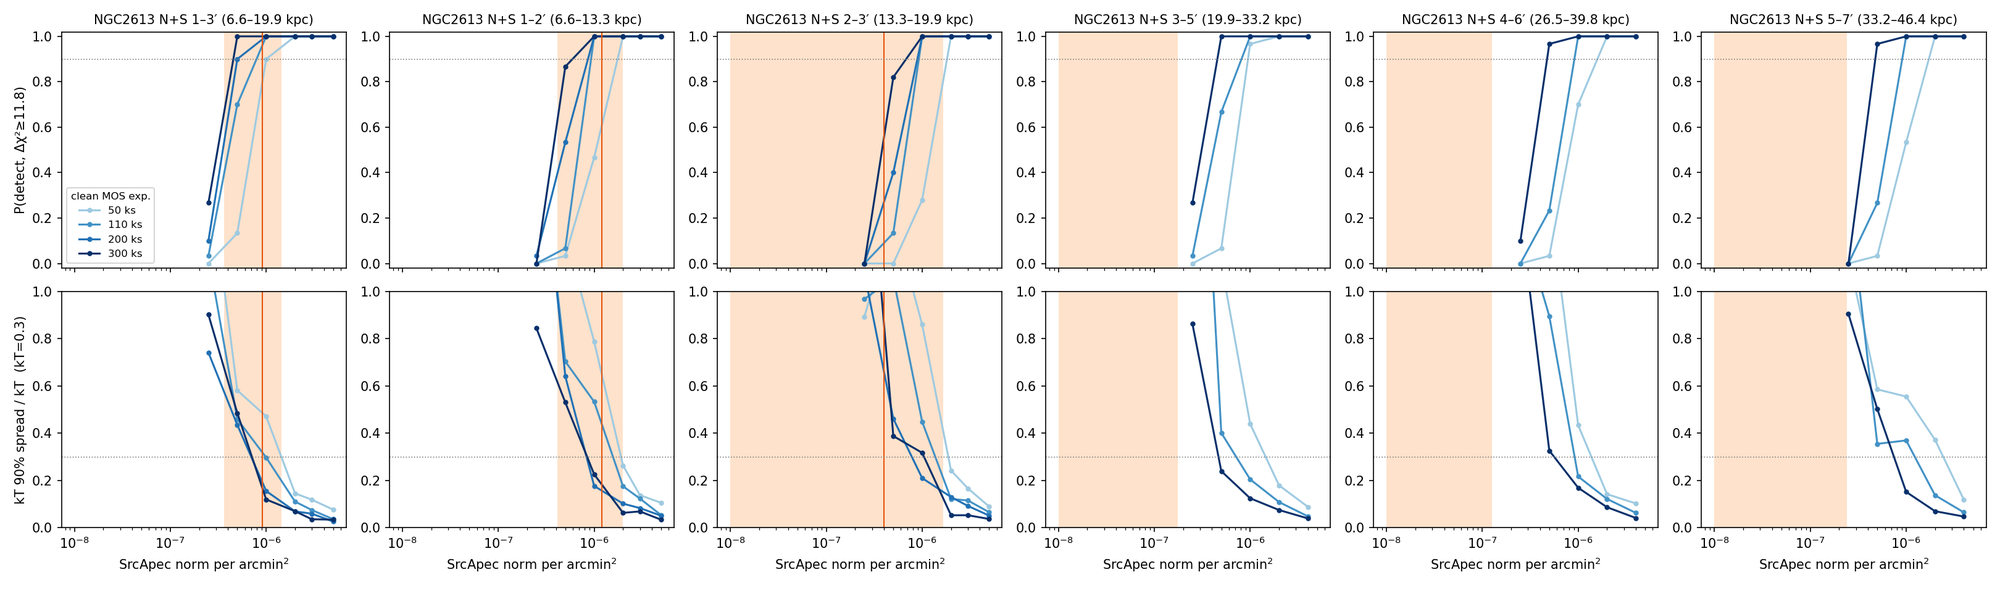
The existing outer boxes have real responses and backgrounds, so their detection and temperature limits can be computed now even though their brightness is only an upper limit. Truth: SrcApec with kT = 0.3 keV on a norm grid (0.25–4 ×10⁻⁶ per arcmin²). A box “sees the halo” at exposure T if the halo there is brighter than the 90% detection norm; the temperature is measurable if it is brighter than the “kT ±30%” norm.
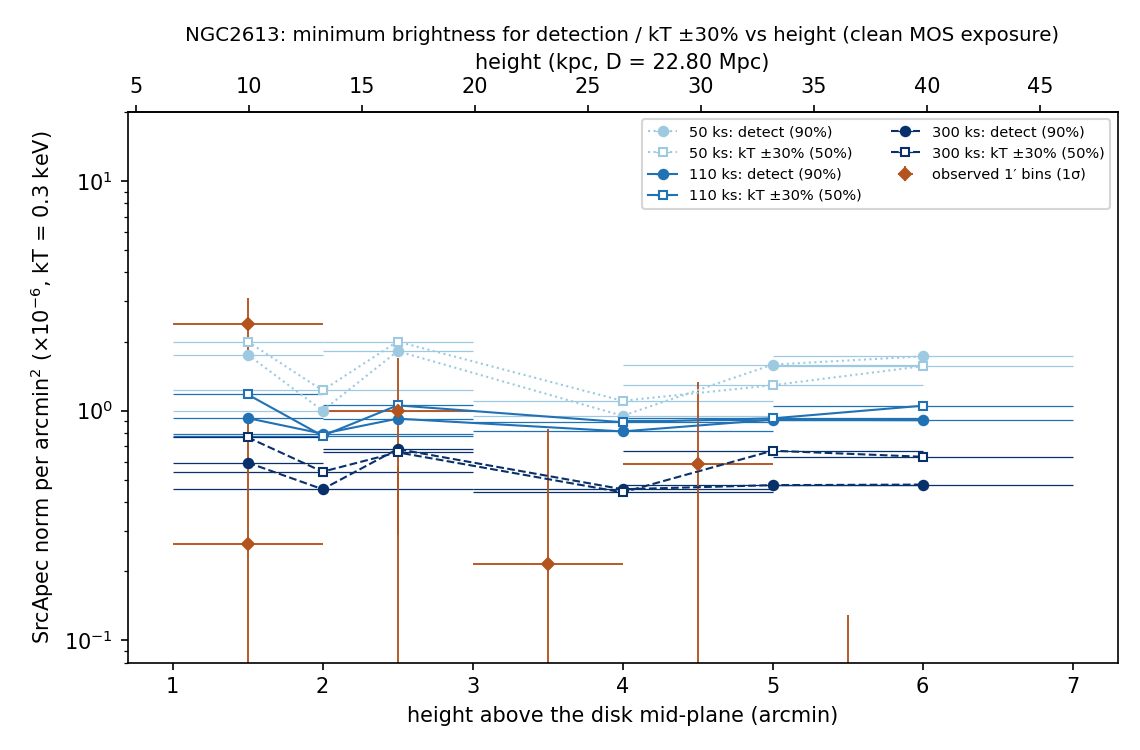
| Box | Height (kpc) | Clean T (ks) | norm for 90% detection | kT ±30% in 50% | kT ±30% in 90% | SB for 90% detection (erg/s/cm²/arcmin²) | Chandra-profile norm (side + / −) | With the Chandra profile |
|---|---|---|---|---|---|---|---|---|
| N+S 3–5′ | 20–33 | 50 | 9.5×10⁻⁷ | 1.1×10⁻⁶ | 2.0×10⁻⁶ | 5.9×10⁻¹⁶ | — | — |
| N+S 3–5′ | 20–33 | 110 | 8.1×10⁻⁷ | 8.9×10⁻⁷ | 1.7×10⁻⁶ | 5.0×10⁻¹⁶ | — | — |
| N+S 3–5′ | 20–33 | 300 | 4.5×10⁻⁷ | 4.4×10⁻⁷ | 8.5×10⁻⁷ | 2.8×10⁻¹⁶ | — | — |
| N+S 4–6′ | 27–40 | 50 | 1.6×10⁻⁶ | 1.3×10⁻⁶ | 2.0×10⁻⁶ | 9.8×10⁻¹⁶ | — | — |
| N+S 4–6′ | 27–40 | 110 | 9.1×10⁻⁷ | 9.3×10⁻⁷ | 1.7×10⁻⁶ | 5.7×10⁻¹⁶ | — | — |
| N+S 4–6′ | 27–40 | 300 | 4.7×10⁻⁷ | 6.7×10⁻⁷ | 1.2×10⁻⁶ | 2.9×10⁻¹⁶ | — | — |
| N+S 5–7′ | 33–46 | 50 | 1.7×10⁻⁶ | 1.6×10⁻⁶ | 3.2×10⁻⁶ | 1.1×10⁻¹⁵ | — | — |
| N+S 5–7′ | 33–46 | 110 | 9.1×10⁻⁷ | 1.1×10⁻⁶ | 1.9×10⁻⁶ | 5.6×10⁻¹⁶ | — | — |
| N+S 5–7′ | 33–46 | 300 | 4.8×10⁻⁷ | 6.3×10⁻⁷ | 1.0×10⁻⁶ | 3.0×10⁻¹⁶ | — | — |
Dependence on the true temperature (N+S 1–3′, 110 ks clean, measured norm)
| True kT (keV) | P(detect) | Fitted kT median [5%, 95%] | kT 5–95% half-width | Own 90% error within ±30% | N |
|---|---|---|---|---|---|
| 0.2 | 58% | 0.20 [0.16, 0.26] | ±24% | 40% | 50 |
| 0.3 | 100% | 0.29 [0.26, 0.35] | ±14% | 60% | 60 |
| 0.5 | 100% | 0.50 [0.39, 0.58] | ±19% | 74% | 50 |
9. Sensitivity to the eROSITA stacked CGM profile
Each box is one measurement point that can be placed directly on the eROSITA stacked CGM profile (Zhang et al. 2024, eRASS, 0.5–2 keV, AGN/XRB/satellite contamination removed; β-model fits for the MW-mass and M31-mass bins). Our measurement is differential — each box minus a background box in the same pointing — so the stack prediction is computed the same way: the β model averaged over the real box geometry minus its average over the background box. Statistical errors for 100 ks clean MOS are the observed (kT fixed at 0.3 keV, outermost-box background) errors scaled by √(Tnow/T), a scaling confirmed by the Monte-Carlo. Systematics dominate: SrcApec norm 1×10⁻⁶ gives only ≈5% of the total 0.5–2 keV background count rate (sky + QPB + instrument), so a 1% background error equals 0.19×10⁻⁶ — comparable to the 100 ks statistical error. Realistic XMM background systematics (QPB spatial non-uniformity, residual soft protons, CXB fluctuations) are 2–5%.
NGC 2613: at 22.8 Mpc the field reaches farther in kpc and N+S boxes halve the error. At 100 ks clean the 13–20 kpc bin tests the stack at S/N ≈ 2.7 (MW-mass) / 6.0 (M31-mass) and 20–33 kpc at 1.5 / 3.6 (statistical); 33–46 kpc is below the errors. σA ≈ 0.14 (M31-mass) / 0.31 (MW-mass) statistically, 0.28 / 0.62 with a 2% background systematic. The existing 23 ks give A = 0.6 ± 0.3 (M31-mass) and 1.3 ± 0.7 (MW-mass): consistent with the stack.
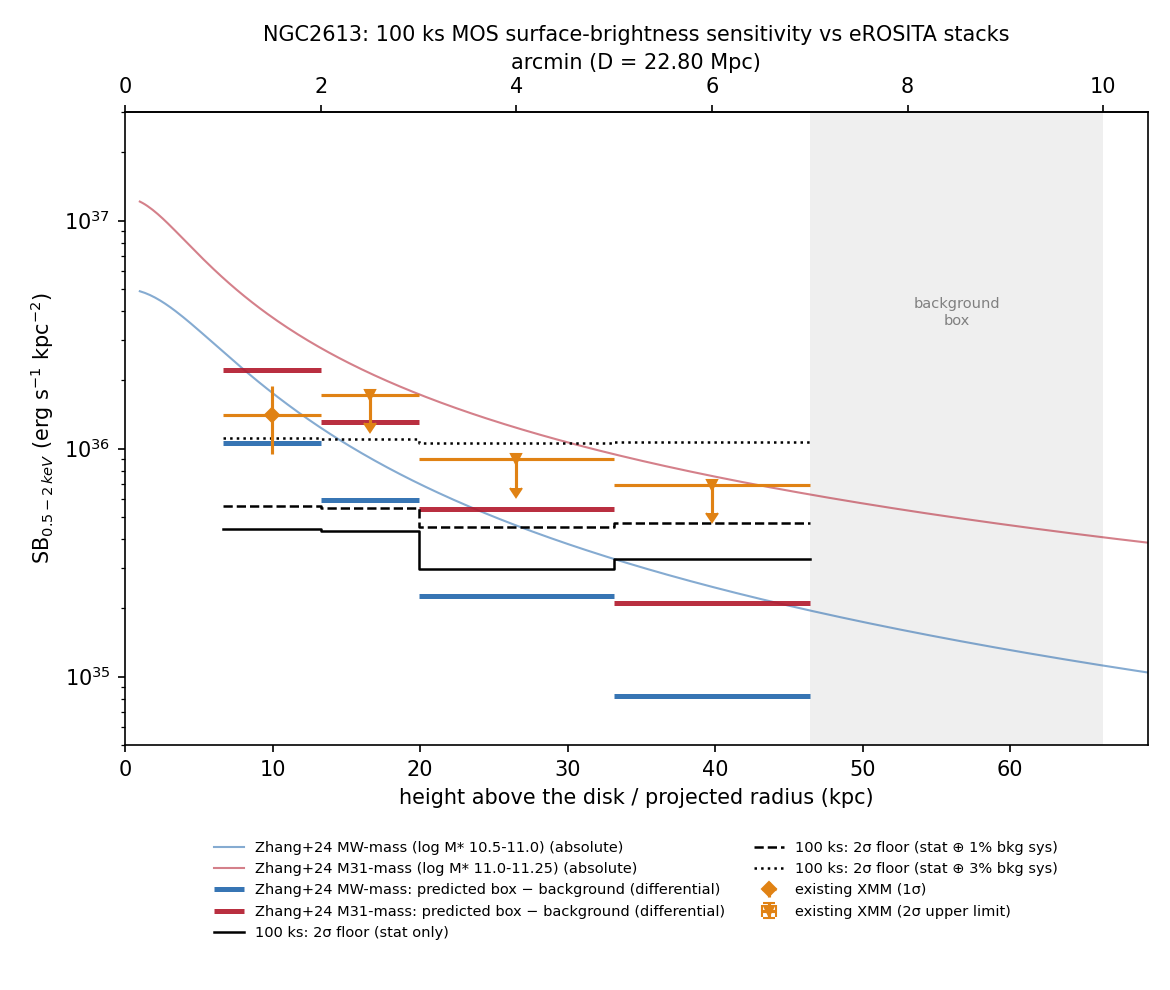
| Box | Radius (kpc) | Existing (10⁻⁶, 1σ) | σstat at 100 ks (10⁻⁶; erg/s/kpc²) | σsys 1%% / 3%% (10⁻⁶) | MW-mass prediction (S/N stat / stat⊕2% sys) | M31-mass prediction (S/N stat / stat⊕2% sys) |
|---|---|---|---|---|---|---|
| N 1 2+S 1 2 | 7–13 | +1.61 ± 0.53 | 0.25 (2.2×1035) | 0.19 / 0.58 | 1.20 (4.7 / 2.6) | 2.52 (9.9 / 5.4) |
| N 2 3+S 2 3 | 13–20 | +0.93 ± 0.52 | 0.25 (2.2×1035) | 0.19 / 0.58 | 0.68 (2.7 / 1.5) | 1.50 (6.0 / 3.3) |
| N 3 5 (10′)+S 3 5 (10′) | 20–33 | +0.32 ± 0.35 | 0.17 (1.5×1035) | 0.19 / 0.58 | 0.26 (1.5 / 0.6) | 0.62 (3.7 / 1.5) |
| N 5 7 (10′)+S 5 7 (10′) | 33–46 | +0.01 ± 0.39 | 0.19 (1.6×1035) | 0.19 / 0.58 | 0.09 (0.5 / 0.2) | 0.24 (1.3 / 0.6) |
One number per galaxy: scale factor A of the stacked profile (A = 1 is the stack), boxes at ≥ 10 kpc
| Stack | Existing data: A ± 1σ | 100 ks σA, sys 0% | 100 ks σA, sys 1% | 100 ks σA, sys 2% | 100 ks σA, sys 3% |
|---|---|---|---|---|---|
| MW-mass | 1.31 ± 0.66 | 0.31 | 0.42 | 0.62 | 0.86 |
| M31-mass | 0.58 ± 0.29 | 0.14 | 0.18 | 0.28 | 0.38 |
10. Sample outlook: can galaxies within 50 Mpc test the eROSITA stack?
A single galaxy gives one scale factor A of the stacked profile. The question “are galaxies within 50 Mpc systematically fainter than the eROSITA stacks?” is a question about the sample mean of A, whose error falls as 1/√N because the background systematics of different pointings are independent. This section applies the per-box noise measured in NGC 4565 and NGC 2613 to every galaxy of the edge-on sample atlas with log M* ≥ 10.5 (all within 23 Mpc). Model: height bins 10–20, 20–30 and 30–50 kpc on both sides of the disk, each box ≥1′ from the mid-plane and ≤11′ off-axis, differential against an 11–14′ background box; σstat = c(θ)/√(Ω·T) with c(θ) fitted to the nine real boxes of the two galaxies (±15%%); 1%% background systematic = 0.2×10⁻⁶ per box; every σA is multiplied by 1.3 so that the generic geometry reproduces the direct per-box result for NGC 4565 and NGC 2613.
- One galaxy, 100 ks clean: σA ≈ 0.39 (MW-mass stack) and ≈ 0.17 (M31-mass) with a 1% background systematic, almost flat from 10 to 30 Mpc: nearer galaxies have more area per kpc but the field of view cuts off the outer bins (below ≈8 Mpc the 20–50 kpc range needs a mosaic); farther galaxies lose area (0.77 / 0.30 at 50 Mpc). The 10–20 kpc bin carries most of the weight (S/N ≈ 3 for A = 1, MW-mass); 30–50 kpc adds S/N ≲ 0.6.
- A single MW-mass galaxy cannot establish a deficit on its own: A = 0.5 is only ≈1.3σ from A = 1. An M31-mass galaxy (σA ≈ 0.18) can.
- Sample, 100 ks each: the 22 atlas galaxies with log M* ≥ 10.5 give σ(⟨A⟩) = 0.05 (stat only) / 0.08 (1% sys) / 0.13 (2% sys).
- Archival XMM alone (12 of them have data; clean time taken as 0.6 × nominal): σ(⟨A⟩) = 0.07 / 0.12 / 0.18. The test “⟨A⟩ = 1 vs ⟨A⟩ ≈ 0.5” is therefore already feasible with the archive (≈4σ at 1% systematic, ≈2.7σ at 2%), if the archival pointings are on target and the per-galaxy analysis is uniform; new 100 ks pointings mainly buy M31-mass leverage and clean, centred geometry.
- Radial range of the test: 10–30 kpc. Points at 30–50 kpc stay below 1σ each and only constrain the stack jointly.
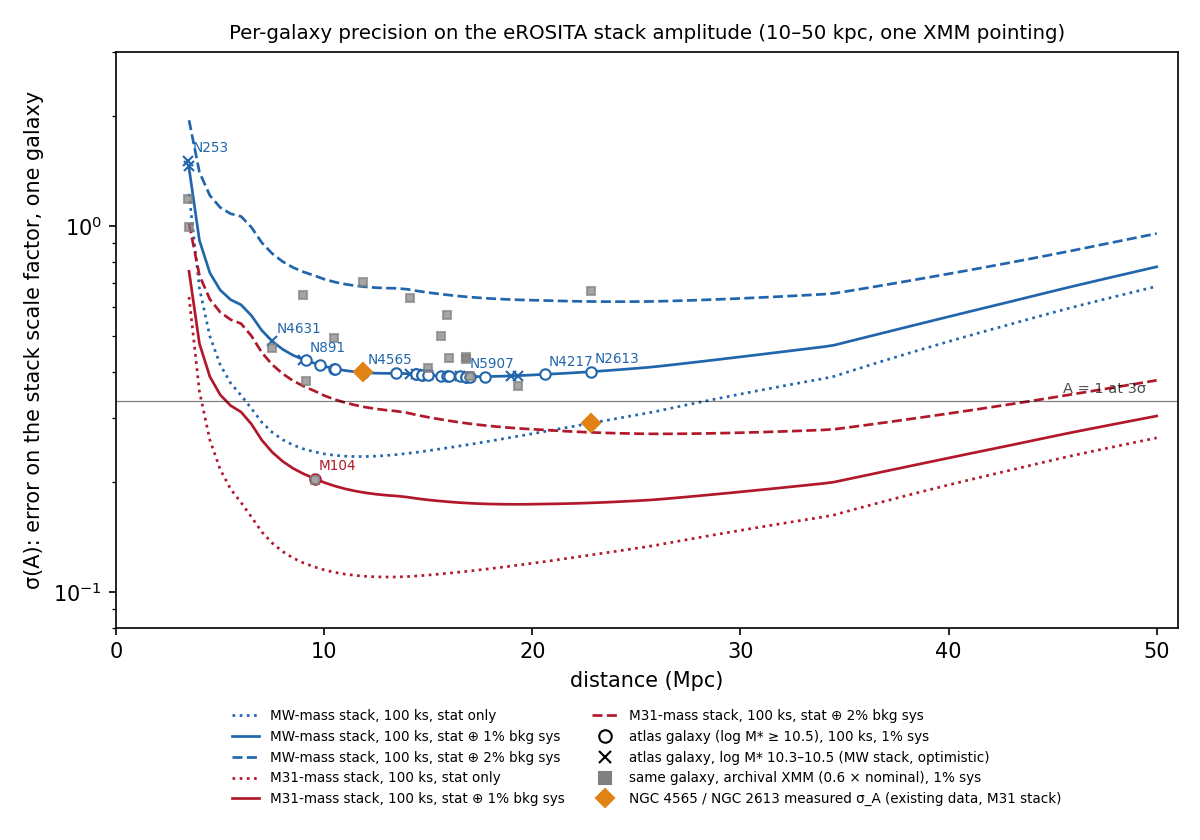
| Galaxy | D (Mpc) | log M* | Stack bin | Archival clean (ks, est.) | σA archival, 1%% sys | σA 100 ks, stat | σA 100 ks, 1%% sys | σA 100 ks, 2%% sys | Bins (kpc): S/N for A = 1 at 100 ks, 1%% sys |
|---|---|---|---|---|---|---|---|---|---|
| NGC 891 | 9.1 | 10.77 | MW | 314 | 0.38 | 0.25 | 0.43 | 0.75 | 10–20: 2.9, 20–29.1: 0.7 |
| M104 | 9.6 | 11.09 | M31 | 106 | 0.20 | 0.12 | 0.20 | 0.35 | 10–20: 6.1, 20–30: 1.7 |
| NGC 3115 | 9.8 | 10.83 | MW | — | — | 0.24 | 0.42 | 0.72 | 10–20: 3.0, 20–30: 0.8, 30–31.3: 0.1 |
| NGC 3628 | 10.5 | 10.84 | MW | 42 | 0.49 | 0.24 | 0.41 | 0.70 | 10–20: 3.0, 20–30: 0.9, 30–33.5: 0.2 |
| NGC 1023 | 10.5 | 10.59 | MW | — | — | 0.24 | 0.41 | 0.70 | 10–20: 3.0, 20–30: 0.9, 30–33.6: 0.2 |
| NGC 4565 | 11.9 | 10.88 | MW | 14 | 0.70 | 0.23 | 0.40 | 0.68 | 10–20: 3.1, 20–30: 1.1, 30–38: 0.3 |
| NGC 3175 | 13.4 | 10.55 | MW | — | — | 0.24 | 0.40 | 0.68 | 10–20: 3.0, 20–30: 1.2, 30–43: 0.4 |
| NGC 4438 | 14.4 | 10.75 | MW | — | — | 0.24 | 0.39 | 0.67 | 10–20: 3.0, 20–30: 1.2, 30–46.1: 0.4 |
| NGC 7814 | 14.4 | 10.71 | MW | — | — | 0.24 | 0.39 | 0.67 | 10–20: 3.0, 20–30: 1.2, 30–46.1: 0.4 |
| NGC 5866 | 14.7 | 10.67 | MW | — | — | 0.24 | 0.39 | 0.66 | 10–20: 3.0, 20–30: 1.2, 30–47: 0.4 |
| NGC 4026 | 14.7 | 10.53 | MW | — | — | 0.24 | 0.39 | 0.66 | 10–20: 3.0, 20–30: 1.2, 30–47.1: 0.4 |
| NGC 1532 | 15.0 | 10.73 | MW | 81 | 0.41 | 0.24 | 0.39 | 0.66 | 10–20: 3.0, 20–30: 1.2, 30–48: 0.4 |
| NGC 4157 | 15.6 | 10.74 | MW | 38 | 0.50 | 0.25 | 0.39 | 0.65 | 10–20: 3.1, 20–30: 1.3, 30–49.9: 0.4 |
| NGC 134 | 15.9 | 10.99 | MW | 26 | 0.57 | 0.25 | 0.39 | 0.65 | 10–20: 3.1, 20–30: 1.3, 30–50: 0.5 |
| NGC 4013 | 16.0 | 10.77 | MW | 61 | 0.44 | 0.25 | 0.39 | 0.65 | 10–20: 3.1, 20–30: 1.3, 30–50: 0.5 |
| NGC 4710 | 16.5 | 10.70 | MW | — | — | 0.25 | 0.39 | 0.64 | 10–20: 3.1, 20–30: 1.3, 30–50: 0.5 |
| NGC 4302 | 16.8 | 10.70 | MW | 60 | 0.44 | 0.25 | 0.39 | 0.64 | 10–20: 3.1, 20–30: 1.3, 30–50: 0.5 |
| NGC 5907 | 16.8 | 10.98 | MW | 63 | 0.43 | 0.25 | 0.39 | 0.64 | 10–20: 3.1, 20–30: 1.3, 30–50: 0.5 |
| NGC 4388 | 17.0 | 10.60 | MW | 99 | 0.39 | 0.25 | 0.39 | 0.64 | 10–20: 3.0, 20–30: 1.3, 30–50: 0.5 |
| NGC 1448 | 17.7 | 10.67 | MW | — | — | 0.26 | 0.39 | 0.64 | 10–20: 3.0, 20–30: 1.3, 30–50: 0.5 |
| NGC 4217 | 20.6 | 10.76 | MW | — | — | 0.27 | 0.39 | 0.63 | 10–20: 3.0, 20–30: 1.3, 30–50: 0.6 |
| NGC 2613 | 22.8 | 10.95 | MW | 23 | 0.66 | 0.29 | 0.40 | 0.62 | 10–20: 2.9, 20–30: 1.3, 30–50: 0.6 |
11. Answers for the proposal
- Good time now: ObsID 0149160201 MOS spectrum exposures 22.97 / 23.01 ks, pn 17.85 ks; ObsID 0149160101 is dominated by flaring and not used.
- A point on the eROSITA stacked profile: NGC 2613 provides independent points at 13–20 and 20–33 kpc; with 100 ks clean the stack scale factor is measured to σA ≈ 0.14 (M31-mass) / 0.31 (MW-mass) statistically, ≈0.28 / 0.62 with a 2% background systematic. The existing data are consistent with the stack (A = 0.6 ± 0.3 vs M31-mass), so NGC 2613 and NGC 4565 together would test whether individual massive spirals scatter around or lie systematically below the stack.
- Halo signal in the existing data: N+S 1–3′ (6.6–19.9 kpc) SrcApec only at Δχ² ≈ 8.5; for kT = 0.3 keV, norm = (0.9 ± 0.5)×10-6 arcmin-2 (90%), ≈5.6×10⁻¹⁶ erg s-1 cm-2 arcmin-2 (0.5–2 keV, unabsorbed).
- Temperature vs exposure: with the measured brightness as truth, N+S 1–3′ is detected in 85% of realizations with a ±37% kT spread at 50 ks clean, and in 100% with ±14% at 110 ks. 1–2′ alone gives ±20% at 110 ks. 2–3′ is detected in only ~37% of realizations even at 300 ks.
- Minimum brightness (brightness grid, kT = 0.3 keV): at 110 ks clean, 90% detection needs norm ≈ 0.8×10⁻⁶ arcmin-2 in N+S 1–3′ (≈22 arcmin²) and ≈0.9×10⁻⁶ in the N+S 1′ bins; kT within ±30% in half of the realizations needs ≈0.8–1.2×10⁻⁶. At 50 ks these rise to ≈1.0–1.8×10⁻⁶ and ≈1.2–2.0×10⁻⁶. The measured N+S 1–3′ brightness (0.9×10⁻⁶) sits right at the 110 ks limits. Grid limits carry ≈20% Monte-Carlo/interpolation noise.
- How far can 110 ks see? At 20–46 kpc (N+S 3–5′, 4–6′, 5–7′) 90% detection needs norm ≈ 0.8–0.9×10⁻⁶ arcmin-2 at 110 ks clean and ≈ 0.46–0.48×10⁻⁶ at 300 ks. The existing N-side boxes are consistent with zero at 1σ ≈ 0.5×10⁻⁶; the outermost-background check shows the far S side is also ≈0.
- Temperature beyond 3′: at 110 ks, kT within ±30% needs ≈ 0.9–1.05×10⁻⁶ (half of the realizations) or ≈ 1.7–1.9×10⁻⁶ (90%); at 300 ks ≈ 0.44–0.67×10⁻⁶ (half). No positive signal is seen at these heights in the existing data.
- Implication for the proposal: NGC 2613 provides one inner temperature and a brightness profile / upper limits, not a temperature gradient. If kept, its goal should be framed as whether the luminosity shortfall persists in deeper data (the eROSITA-discrepancy angle), with the exposure set by detecting or excluding a given brightness.
- eROSITA comparison: done in §9–10. The existing data are consistent with the stack at 13–46 kpc (A = 0.58 ± 0.29 against the M31-mass profile, 1.3 ± 0.7 against MW-mass). With 100 ks, σA ≈ 0.18 (M31) / 0.42 (MW) at 1% background systematic.
- Sample test (§10): one MW-mass galaxy at 100 ks measures A to ≈0.4 (1% sys), flat from 10 to 30 Mpc, so a single galaxy cannot prove a deficit; the 22 atlas galaxies with log M* ≥ 10.5 would give σ(⟨A⟩) ≈ 0.08 at 100 ks each, and the 12 with archival XMM already ≈0.12. The deficit claim is testable at 10–30 kpc with a sample, not at 30–50 kpc.
12. Caveats and next steps
- MOS only; adding pn raises the counts by ~2.5×.
- QPB and instrumental terms treated as exactly known; the sky-background uncertainty is propagated through the joint fit.
- Single-temperature APEC, abundance fixed at 0.3 solar. The global spectrum in Li et al. (2006) needs two temperatures (0.08 and 0.81 keV), so the real temperature structure may differ from a single 0.3 keV component; the 0.2/0.5 keV cases are still running.
- Distance 22.8 ± 3.3 Mpc (Tully–Fisher): the kpc scale is uncertain by ~15%.
- The measured brightness is only ≈2.5σ; the truth may be fainter — use the brightness-grid results.