NGC 2613 hot halo: existing data and XMM-Newton exposure feasibility
1. Existing XMM data and good time
This page uses the MOS spectra of ObsID 0149160201 only. ObsID 0149160101 is affected by strong background flaring (the draft calls it unusable) and is not used. The filtered GTI of 0149160201 has not yet been re-derived interval by interval as for NGC 4565; the table lists the final spectrum EXPOSURE.
| ObsID | Instrument | Filtered GTI (ks) | Spectrum EXPOSURE (ks) | Note |
|---|---|---|---|---|
| 0149160201 | MOS1 | — | 22.97 | used |
| 0149160201 | MOS2 | — | 23.01 | used |
| 0149160201 | pn | — | 17.85 | not used here |
| 0149160101 | MOS1 / MOS2 / pn | — | 8.10 / 2.06 / 9.61 | strong flaring, not used |
2. Optical and X-ray images
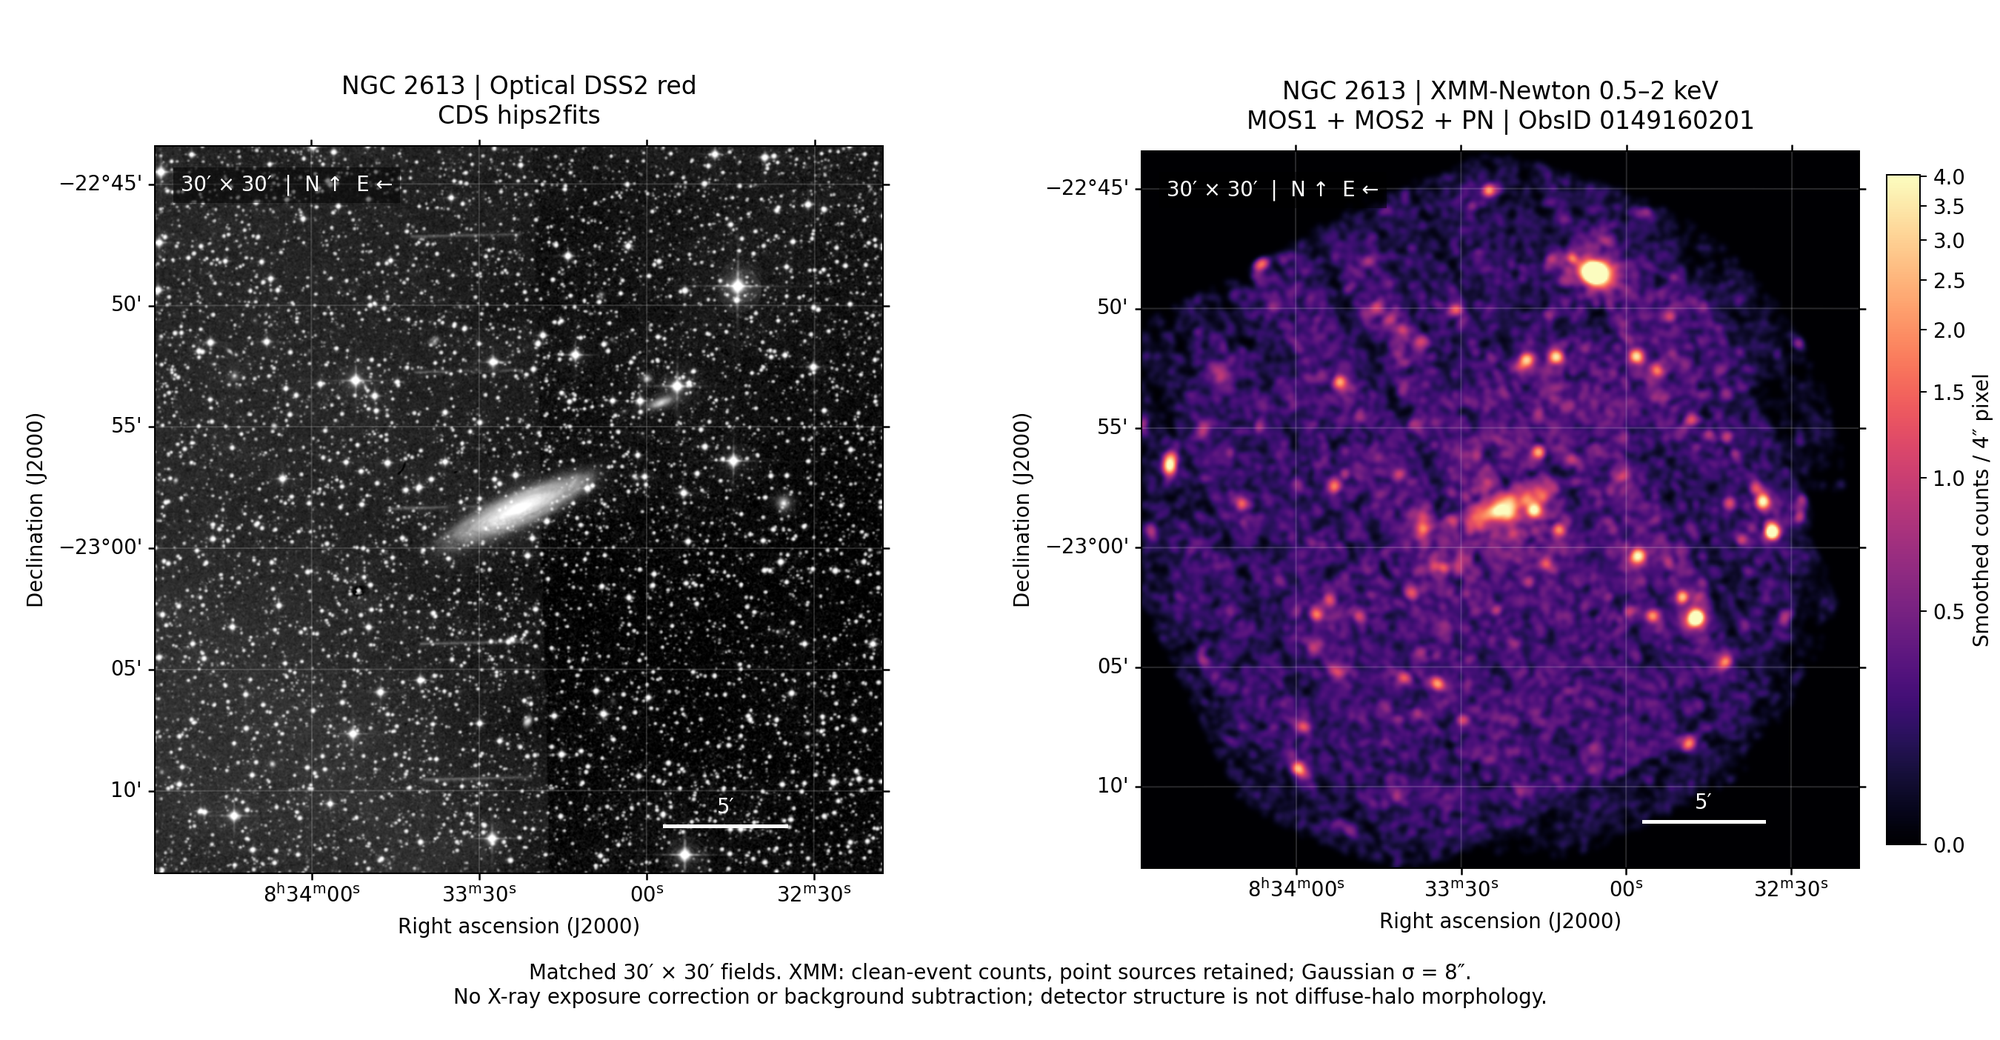
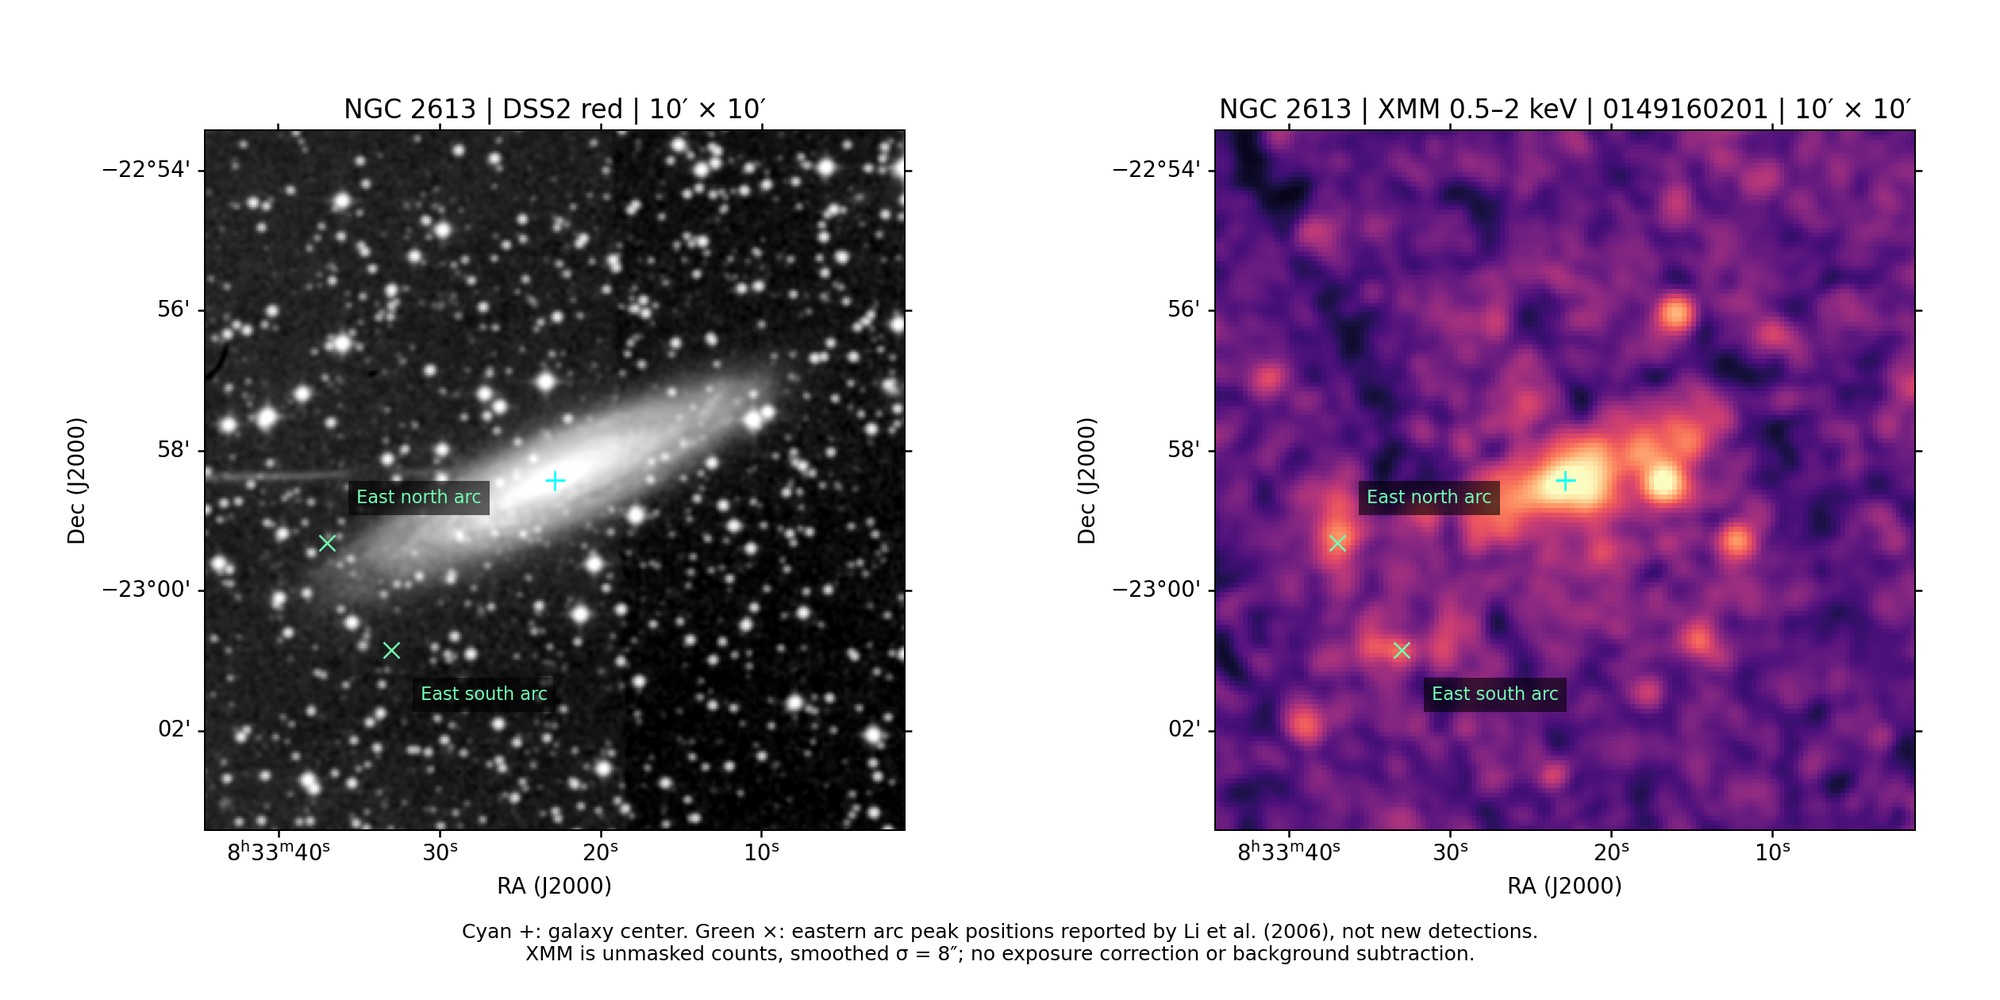
30′ × 30′ fields: DSS2 red (CDS hips2fits) and 0.5–2 keV MOS1+MOS2+pn counts of ObsID 0149160201 (point sources retained, no exposure or background correction). The second panel is a 10′ view marking structures reported in the literature.
3. Spectral extraction regions
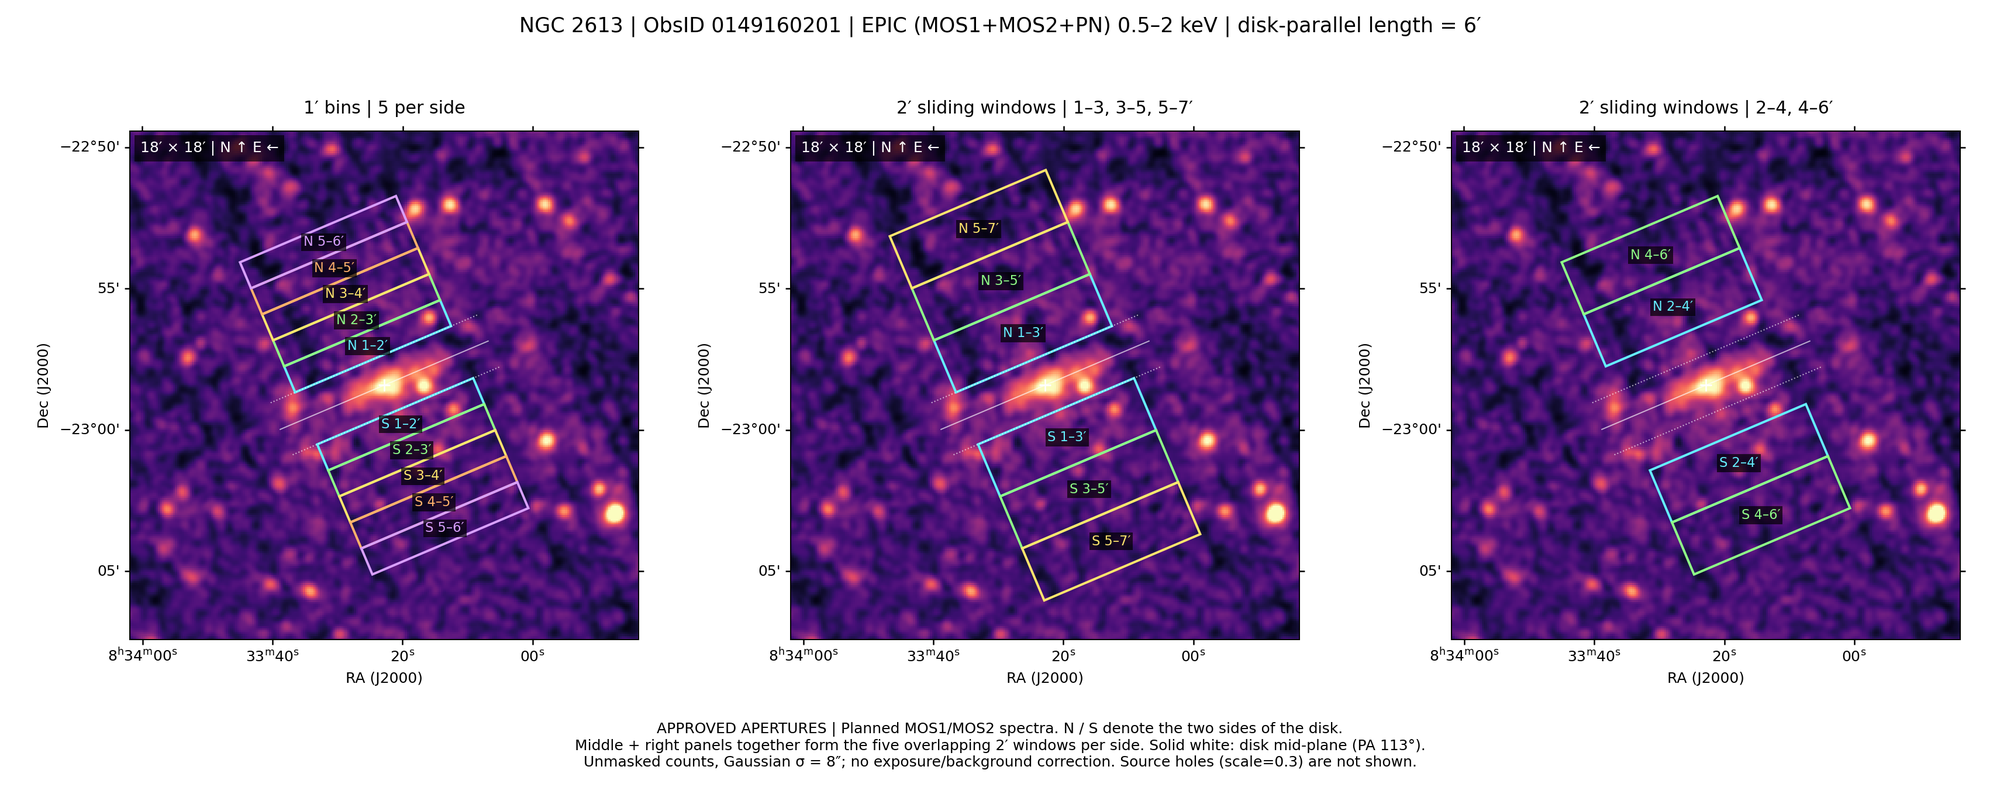
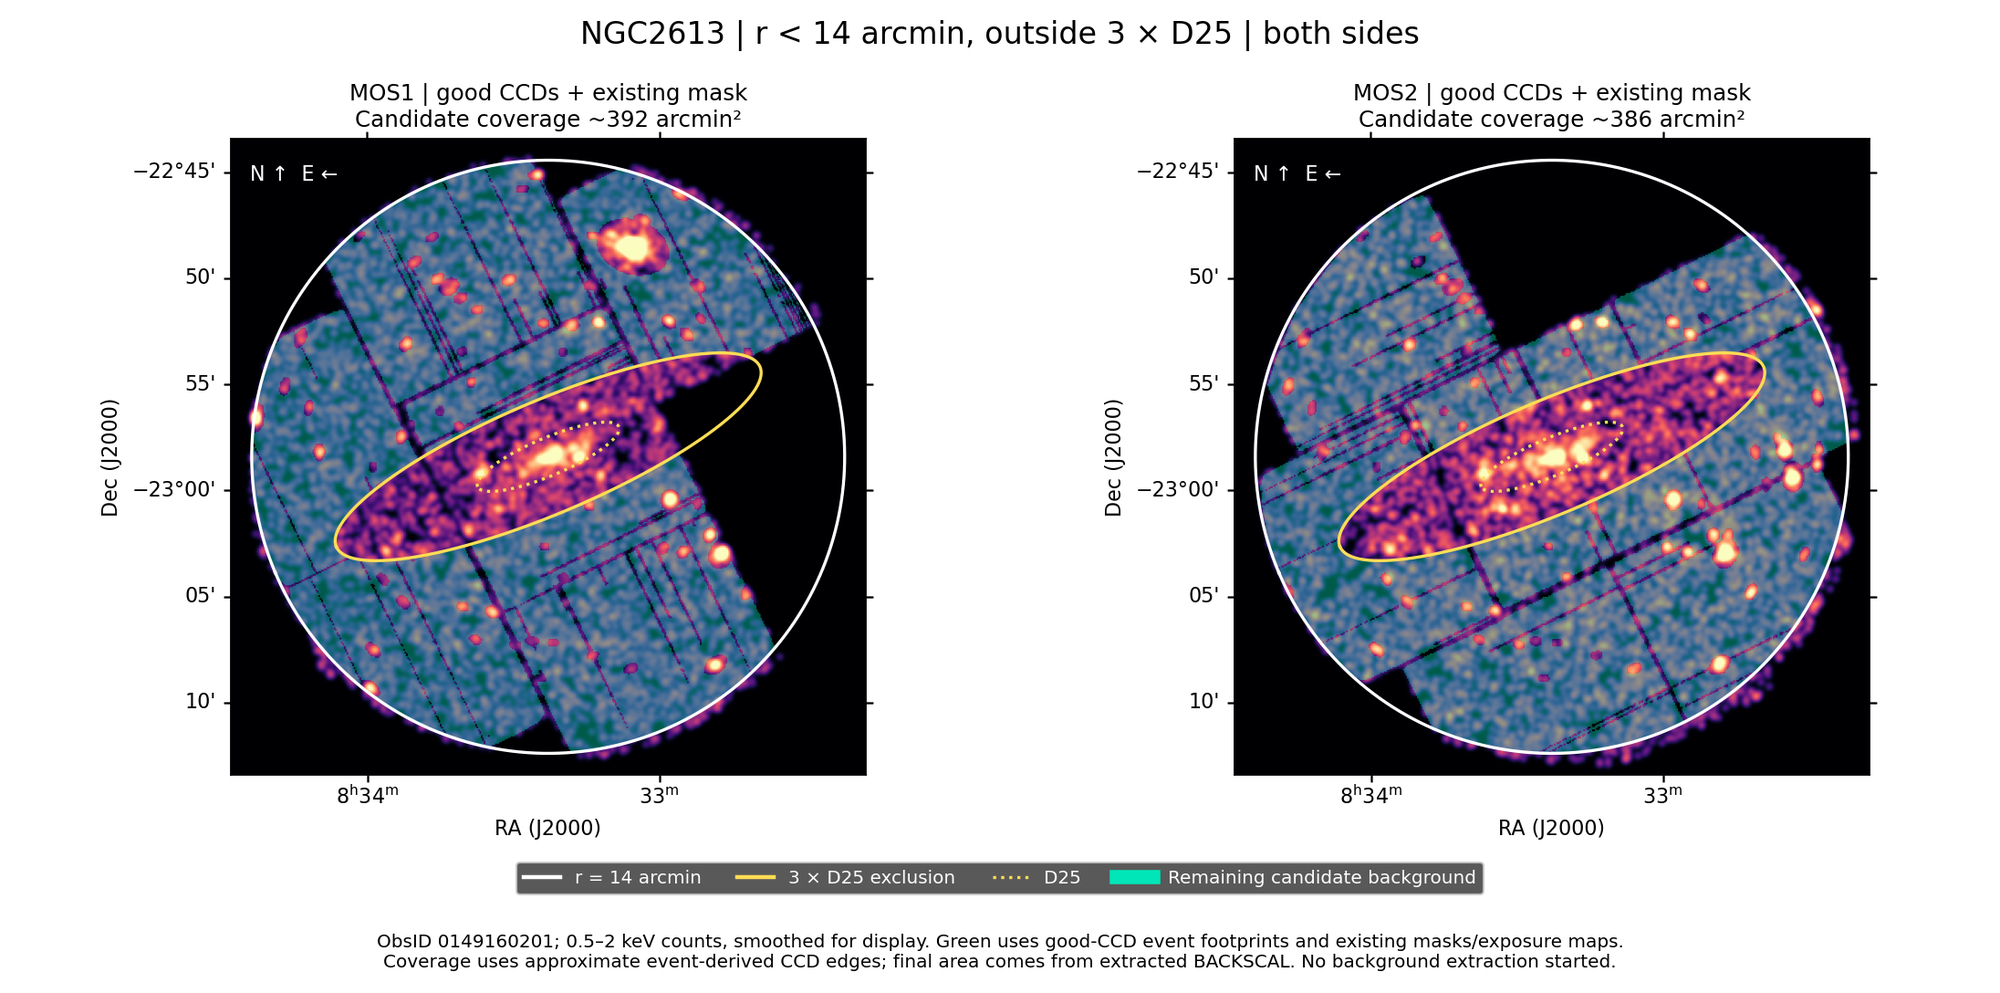
Vertical boxes on both sides of the disk (N and S), 6′ long parallel to the disk; point sources removed with cheese scale = 0.3. N and S spectra at the same height are fitted jointly (own responses, shared SrcApec). The background region is r < 14′ and outside 3 × D25.
| Region set | Regions | Height (kpc) | Effective area (arcmin²; after point-source removal, MOS mean, sides summed) | Role |
|---|---|---|---|---|
| N+S 1–3′ | N_1_3 + S_1_3 | 6.6–19.9 | 22.0 | baseline (wide halo region) |
| N+S 1–2′ | N_1_2 + S_1_2 | 6.6–13.3 | 10.9 | height bin |
| N+S 2–3′ | N_2_3 + S_2_3 | 13.3–19.9 | 11.1 | height bin |
| BKG | BKG_r14_out3D25 | — | 406 / 398 (MOS1/MOS2) | r < 14′ and outside 3×D25 |
4. Vertical surface-brightness profile (existing data)
Every extracted box fitted on its own (kT fixed at 0.3 keV, norm allowed to go negative). Only S 1–2′ shows a clear signal (Δχ² ≈ 11); the N side is consistent with zero at all heights — a north–south asymmetry. The current background region starts at z ≈ 2.7′ (18 kpc); outer boxes with a more distant background (S 7–10′) are being extracted.

| Box | Height (kpc) | Area (arcmin², MOS mean) | Spectra | norm per arcmin² (1σ) | Δχ² (1 d.o.f.) | SB 0.5–2 keV (erg/s/cm²/arcmin²) |
|---|---|---|---|---|---|---|
| N 1–2′ | 6.6–13.3 | 5.5 | MOS1+MOS2 | 2.6×10⁻⁷ ± 5.6×10⁻⁷ | 0.2 | 1.6×10⁻¹⁶ |
| N 2–3′ | 13.3–19.9 | 5.4 | MOS1+MOS2 | 9.9×10⁻⁷ ± 7.1×10⁻⁷ | 2.0 | 6.1×10⁻¹⁶ |
| N 3–4′ | 19.9–26.5 | 5.5 | MOS1+MOS2 | 0 ± 1.1×10⁻⁷ | -0.0 | 0 |
| N 4–5′ | 26.5–33.2 | 5.4 | MOS1+MOS2 | 5.8×10⁻⁷ ± 9.0×10⁻⁷ | 0.6 | 3.6×10⁻¹⁶ |
| N 5–6′ | 33.2–39.8 | 5.4 | MOS1 | 0 ± 2.4×10⁻⁷ | -0.0 | 0 |
| N 1–3′ | 6.6–19.9 | 10.9 | MOS1+MOS2 | 6.4×10⁻⁷ ± 4.7×10⁻⁷ | 1.9 | 4.0×10⁻¹⁶ |
| N 2–4′ | 13.3–26.5 | 10.9 | MOS1+MOS2 | 2.9×10⁻⁷ ± 7.5×10⁻⁷ | 0.4 | 1.8×10⁻¹⁶ |
| N 3–5′ | 19.9–33.2 | 10.8 | MOS1+MOS2 | 0 ± 1.5×10⁻⁷ | -0.0 | 0 |
| N 4–6′ | 26.5–39.8 | 9.8 | MOS1+MOS2 | 1.0×10⁻⁷ ± 4.6×10⁻⁷ | 0.0 | 6.3×10⁻¹⁷ |
| N 5–7′ | 33.2–46.4 | 7.8 | MOS1+MOS2 | 0 ± 5.7×10⁻⁷ | -0.0 | 0 |
| S 1–2′ | 6.6–13.3 | 5.4 | MOS1+MOS2 | 2.4×10⁻⁶ ± 7.1×10⁻⁷ | 11.2 | 1.5×10⁻¹⁵ |
| S 2–3′ | 13.3–19.9 | 5.7 | MOS1+MOS2 | 0 ± 5.7×10⁻⁷ | -0.0 | 0 |
| S 3–4′ | 19.9–26.5 | 5.9 | MOS1+MOS2 | 2.1×10⁻⁷ ± 4.8×10⁻⁷ | 0.1 | 1.3×10⁻¹⁶ |
| S 4–5′ | 26.5–33.2 | 6.0 | MOS1+MOS2 | 0 ± 3.6×10⁻⁸ | -0.1 | 0 |
| S 5–6′ | 33.2–39.8 | 5.4 | MOS1 | 0 ± 9.8×10⁻⁸ | -0.0 | 0 |
| S 1–3′ | 6.6–19.9 | 11.1 | MOS1+MOS2 | 1.2×10⁻⁶ ± 4.5×10⁻⁷ | 6.6 | 7.2×10⁻¹⁶ |
| S 2–4′ | 13.3–26.5 | 11.6 | MOS1+MOS2 | 8.1×10⁻⁸ ± 3.9×10⁻⁷ | 0.0 | 5.0×10⁻¹⁷ |
| S 3–5′ | 19.9–33.2 | 11.9 | MOS1+MOS2 | 0 ± 4.7×10⁻⁸ | -0.0 | 0 |
| S 4–6′ | 26.5–39.8 | 10.7 | MOS1+MOS2 | 0 ± 2.0×10⁻⁸ | -0.2 | 0 |
| S 5–7′ | 33.2–46.4 | 10.4 | MOS1+MOS2 | 0 ± 6.3×10⁻⁸ | -0.0 | 0 |
5. Background spectral fit (sky + instrument)
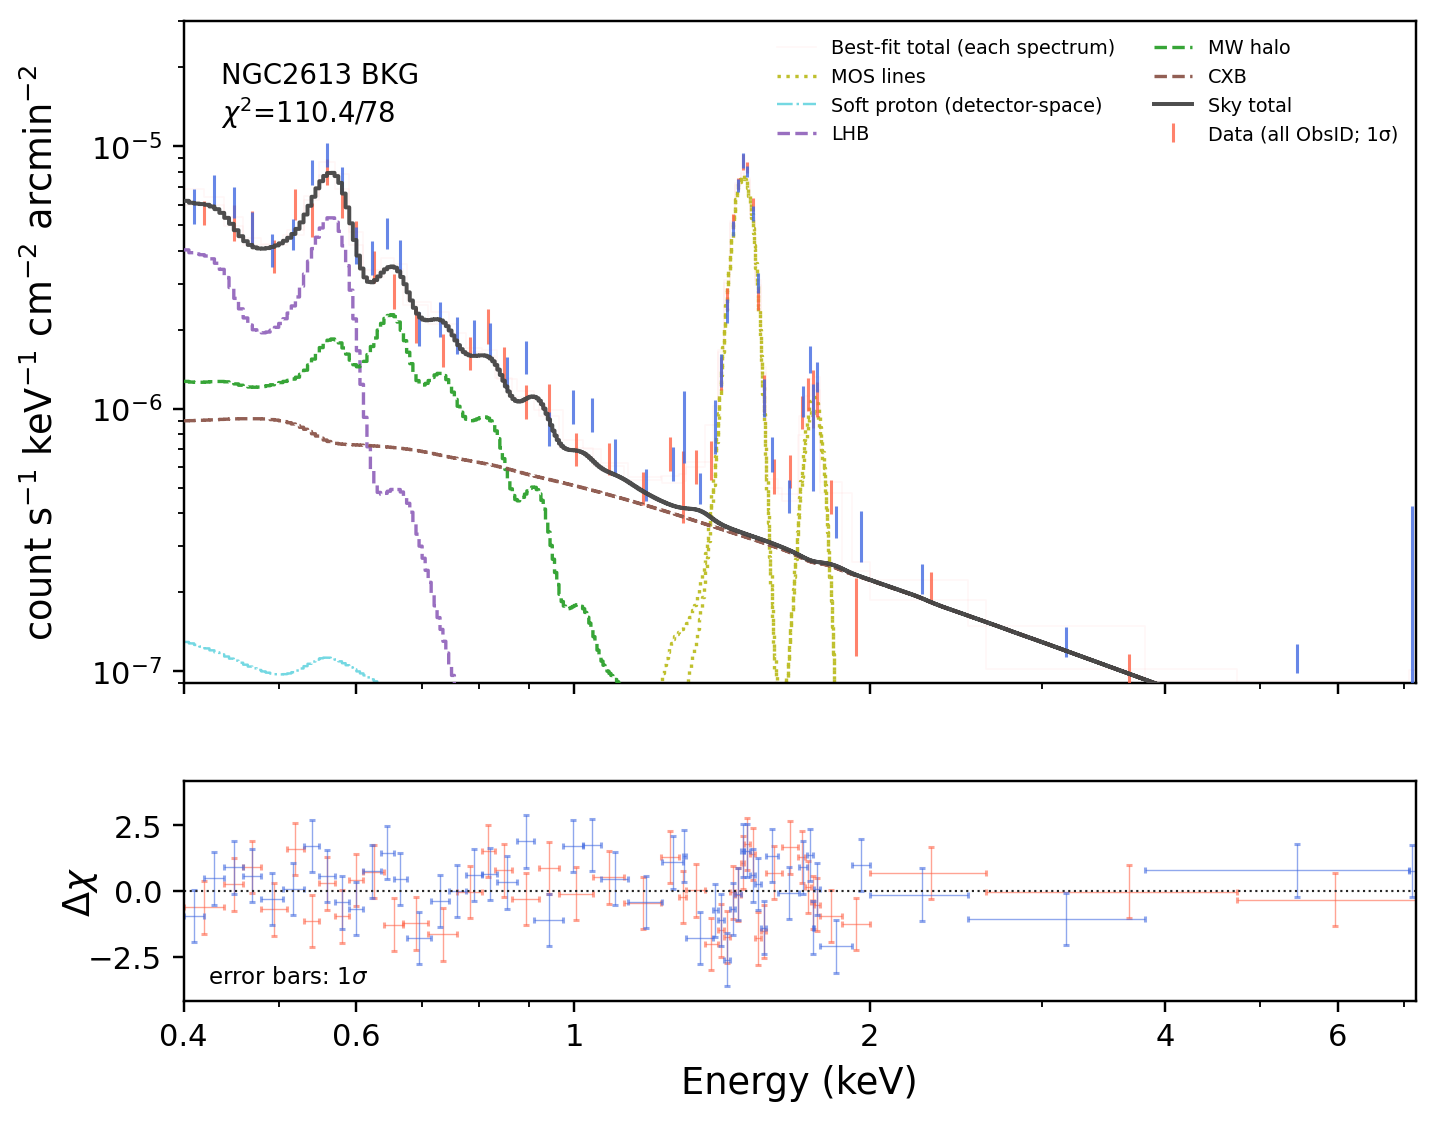
XSherpa recipe xartatoms_0900170701_background (profile status STRUCTURAL_PREFLIGHT_ONLY; no numerical equivalence to XARTATOMS is claimed). The only change is the Galactic NH = 0.0574×1022 cm-2 (HI4PI). Sky components are shared by MOS1/MOS2; instrumental lines and the broken-power-law soft proton are independent per spectrum. Grouping: net S/N ≥ 6 with RMF-FWHM oversampling ≤ 6; 0.4–7.2 keV; chi2gehrels; CIAO 4.18 / Sherpa 4.18 / XSPEC 12.14.0k, angr. χ²/dof = 110.4/78; empirical quality audit: WARN (see note). Norms are per arcmin².
| Component | kT (keV) | norm (per arcmin²) |
|---|---|---|
| LHB | 0.108 | 2.7×10⁻⁶ |
| MW halo | 0.255 | 2.0×10⁻⁶ |
| CXB (pegpwrlw, Γ=1.4) | — | 1.4×10⁻³ |
6. Halo signal in the existing data (SrcApec)
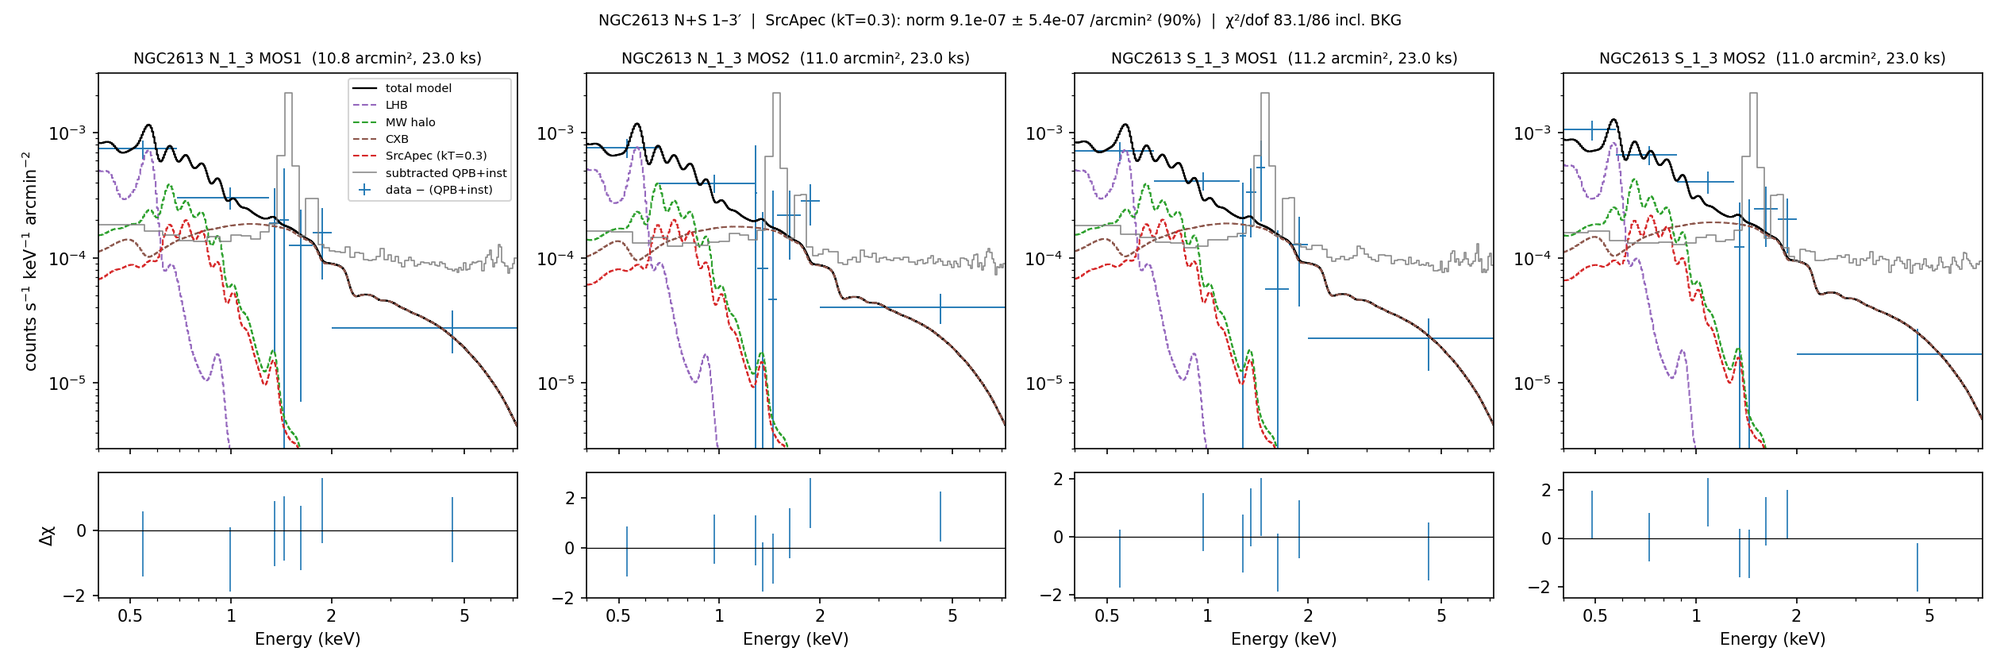
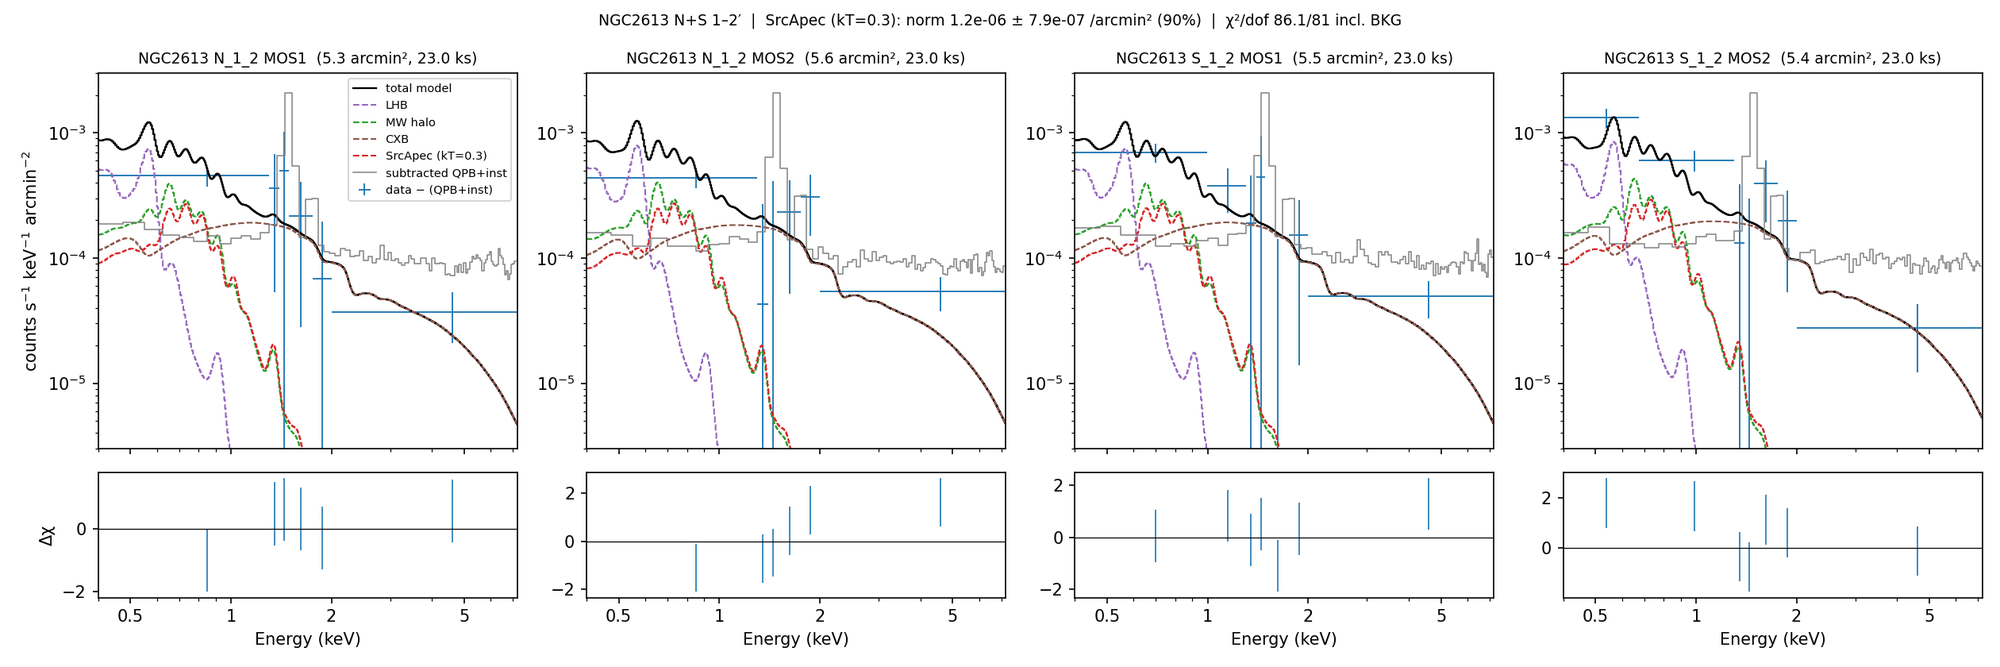
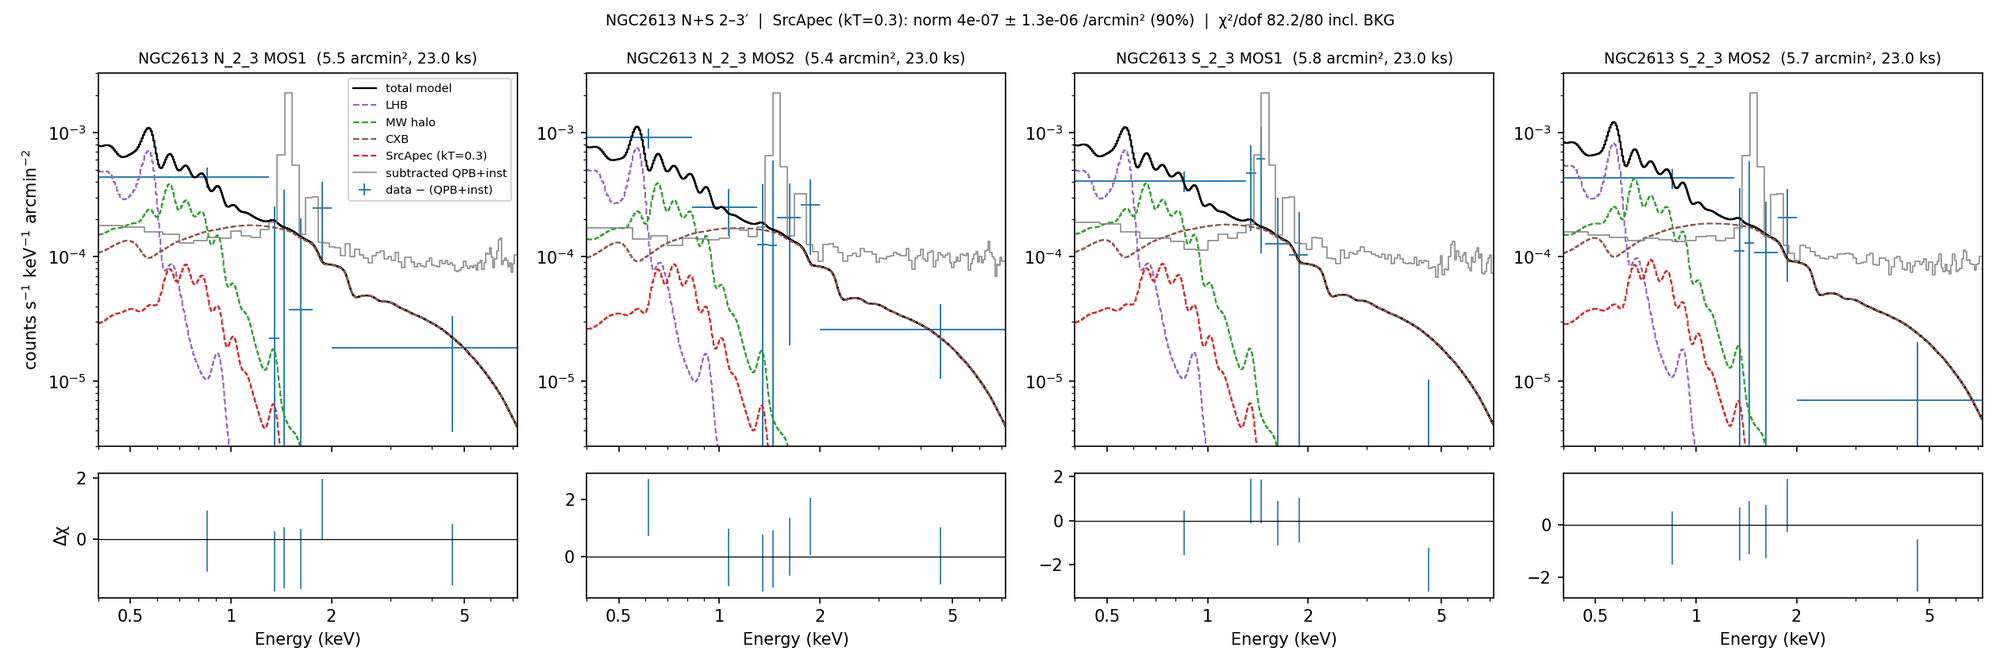
Same estimator as the simulations: source and background spectra fitted jointly; LHB / MW-halo / CXB norms free (temperatures fixed at the background-fit values); MOS instrumental lines and soft protons taken per arcmin² from the background fit and subtracted with the QPB as a known background; SrcApec abundance fixed at 0.3 solar. Δχ² is the increase in χ² when SrcApec is removed (kT and norm free, 2 d.o.f.; 3σ ≈ 11.8). Errors are 90% (covariance). Surface brightness is the unabsorbed 0.5–2 keV energy flux for kT = 0.3 keV: norm 1×10⁻⁶ arcmin-2 ≈ 6.2×10⁻¹⁶ erg s-1 cm-2 arcmin-2.
| Region set | Δχ² | kT, free fit (keV) | norm @ kT = 0.3 (per arcmin², 90%) | SB 0.5–2 keV (erg/s/cm²/arcmin²) | χ²/dof |
|---|---|---|---|---|---|
| N+S 1–3′ | 8.5 | 0.87 | 9.1×10⁻⁷ ± 5.4×10⁻⁷ | 5.6×10⁻¹⁶ | 83.1/86 |
| N+S 1–2′ | 8.1 | unconstrained (at bound 3.00) | 1.2×10⁻⁶ ± 7.9×10⁻⁷ | 7.4×10⁻¹⁶ | 86.1/81 |
| N+S 2–3′ | 1.2 | unconstrained (at bound 0.08) | 4.0×10⁻⁷ ± 1.3×10⁻⁶ | 2.5×10⁻¹⁶ | 82.2/80 |
N+S 1–3′ and 1–2′ reach only Δχ² ≈ 8 (≈2.5σ); a free-kT fit is unconstrained. With kT fixed at 0.3 keV the 1–3′ norm is (0.9 ± 0.5)×10-6 arcmin-2 (90%), about one third of NGC 4565 at the same angular height. 2–3′ is consistent with zero.
7. Simulation method
- Truth: sky from the background-fit anchor; SrcApec (kT, norm per arcmin², Z = 0.3); MOS instrumental lines and soft protons per arcmin² from the background fit; each region’s own ESAS QPB spectrum. Everything is folded through the real ARF/RMF of that region.
- Each realization: Poisson draws for both the source and the background region at a new exposure T (clean time of MOS1 and of MOS2); QPB + instrumental terms subtracted as a known, noise-free background; xsherpa net S/N ≥ 6 grouping; joint chi2gehrels fit with SrcApec kT and norm and the three sky norms free; a second fit without SrcApec gives Δχ².
- Detection: Δχ² ≥ 11.8 (3σ for 2 d.o.f.), checked against the false-positive rate of norm = 0 simulations. Temperature: the 5–95% half-width of the fitted-kT distribution divided by the true kT, and the fraction of realizations whose own 90% error is within ±30%.
- Grid: T = 50, 110, 200, 300 ks clean; kT = 0.3 keV (baseline), 0.2 and 0.5 keV at 110 ks; norm = 0.25–5 ×10⁻⁶ per arcmin² plus the brightness measured in the existing data; 30–100 realizations per cell.
- MOS only; adding pn should raise the counts by ~2.5× (margin, not yet simulated). Instrumental terms and QPB are taken as exactly known; the sky-background uncertainty is propagated through the joint fit.
8. Simulation results
T is the clean MOS exposure. The 110 ks request corresponds to ≈79 ks clean after the SOC-recommended 40% background allowance.
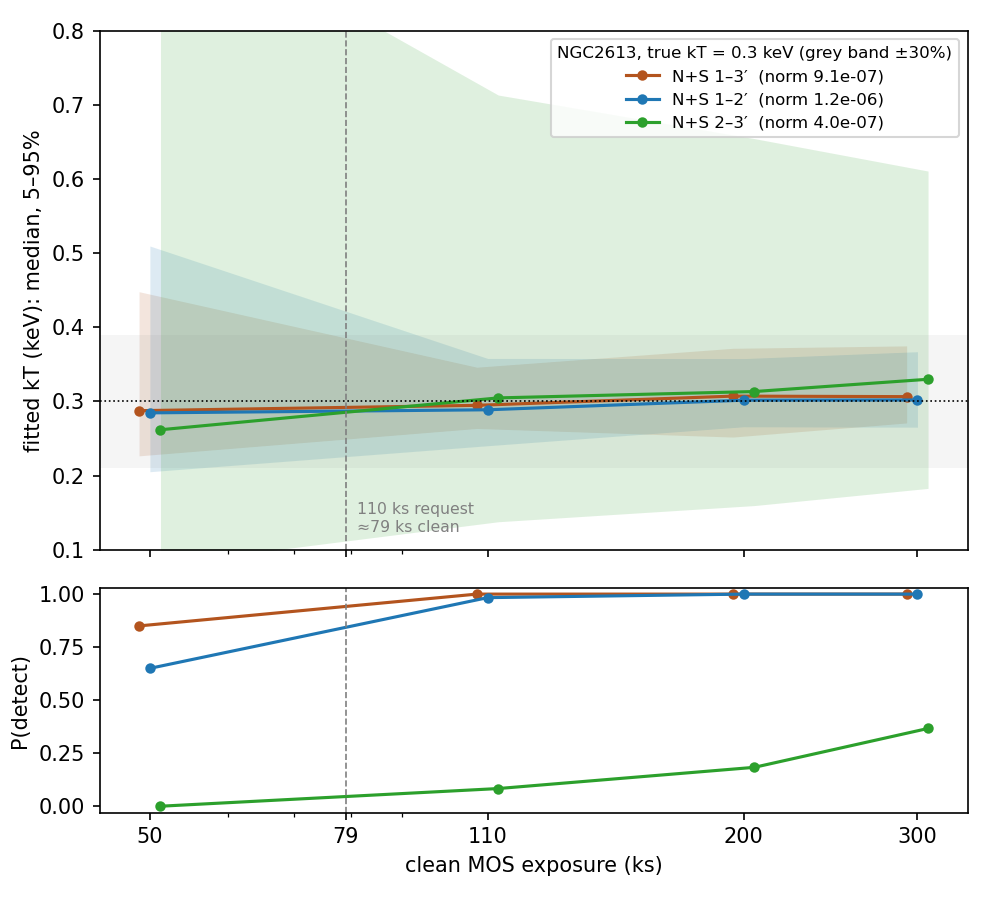
At the brightness measured in the existing data (true kT = 0.3 keV)
| Region set | Clean T (ks) | True norm | P(detect) | Fitted kT median [5%, 95%] | kT 5–95% half-width | Own 90% error within ±30% | N |
|---|---|---|---|---|---|---|---|
| N+S 1–3′ | 50 | 9.1×10⁻⁷ | 85% | 0.29 [0.23, 0.45] | ±37% | 33% | 60 |
| N+S 1–3′ | 110 | 9.1×10⁻⁷ | 100% | 0.29 [0.26, 0.35] | ±14% | 60% | 60 |
| N+S 1–3′ | 200 | 9.1×10⁻⁷ | 100% | 0.31 [0.25, 0.37] | ±20% | 83% | 60 |
| N+S 1–3′ | 300 | 9.1×10⁻⁷ | 100% | 0.31 [0.27, 0.37] | ±17% | 92% | 60 |
| N+S 1–2′ | 50 | 1.2×10⁻⁶ | 65% | 0.28 [0.21, 0.51] | ±51% | 22% | 60 |
| N+S 1–2′ | 110 | 1.2×10⁻⁶ | 98% | 0.29 [0.24, 0.36] | ±20% | 62% | 60 |
| N+S 1–2′ | 200 | 1.2×10⁻⁶ | 100% | 0.30 [0.27, 0.36] | ±15% | 77% | 60 |
| N+S 1–2′ | 300 | 1.2×10⁻⁶ | 100% | 0.30 [0.27, 0.37] | ±17% | 85% | 60 |
| N+S 2–3′ | 50 | 4.0×10⁻⁷ | 0% | 0.26 [0.08, 0.97] | ±148% | 5% | 60 |
| N+S 2–3′ | 110 | 4.0×10⁻⁷ | 8% | 0.30 [0.14, 0.71] | ±96% | 10% | 60 |
| N+S 2–3′ | 200 | 4.0×10⁻⁷ | 18% | 0.31 [0.16, 0.65] | ±83% | 12% | 60 |
| N+S 2–3′ | 300 | 4.0×10⁻⁷ | 37% | 0.33 [0.18, 0.61] | ±71% | 12% | 60 |
9. Answers for the proposal
- Good time now: ObsID 0149160201 MOS spectrum exposures 22.97 / 23.01 ks, pn 17.85 ks; ObsID 0149160101 is dominated by flaring and not used.
- Halo signal in the existing data: N+S 1–3′ (6.6–19.9 kpc) SrcApec only at Δχ² ≈ 8.5; for kT = 0.3 keV, norm = (0.9 ± 0.5)×10-6 arcmin-2 (90%), ≈5.6×10⁻¹⁶ erg s-1 cm-2 arcmin-2 (0.5–2 keV, unabsorbed).
- Temperature vs exposure: with the measured brightness as truth, N+S 1–3′ is detected in 85% of realizations with a ±37% kT spread at 50 ks clean, and in 100% with ±14% at 110 ks. 1–2′ alone gives ±20% at 110 ks. 2–3′ is detected in only ~37% of realizations even at 300 ks.
- Implication for the proposal: NGC 2613 provides one inner temperature and a brightness profile / upper limits, not a temperature gradient. If kept, its goal should be framed as whether the luminosity shortfall persists in deeper data (the eROSITA-discrepancy angle), with the exposure set by detecting or excluding a given brightness.
- eROSITA comparison: the surface-brightness conversion on this page allows a direct comparison with the Zhang et al. stacked profiles; not done yet.
10. Caveats and next steps
- MOS only; adding pn raises the counts by ~2.5×.
- QPB and instrumental terms treated as exactly known; the sky-background uncertainty is propagated through the joint fit.
- Single-temperature APEC, abundance fixed at 0.3 solar. The global spectrum in Li et al. (2006) needs two temperatures (0.08 and 0.81 keV), so the real temperature structure may differ from a single 0.3 keV component; the 0.2/0.5 keV cases are still running.
- Distance 22.8 ± 3.3 Mpc (Tully–Fisher): the kpc scale is uncertain by ~15%.
- The measured brightness is only ≈2.5σ; the truth may be fainter — use the brightness-grid results.